
Improved connectivity, especially through transport links, is an essential condition for economic growth – Here: World Maps, Stats and Lines

Following the Glasgow Climate summit (COP 26), the International Institute for the Middle East and Balkan Studies (IFIMES) conducts a series of research papers and reports that aim at revisiting and rethinking the trans-Oceanic transport and pan-Eurasian (existing and possible) corridors, as a way to de-carbonise our planet for the universal betterment. The present study, coming from the IFIMES Senior Researcher of DeSSA, elaborates also on the so-called ‘Artic Argument’ of professor Anis H. Bajrektarevic, by contrasting and comparing the trans-Oceanic shipping lanes of the warm with those of the cold seas, as well as the need for the new short-cuts in Afro-Asia or the railroad alternatives for the efficient and de-carbonised cross-Eurasian connectivity.
* * * *
Improved connectivity, especially through transport links, is an essential condition for economic growth. Transport links not only provide physical access to resources but also enable producers to take advantage of opportunities in domestic and foreign markets, leading to economies of scale and specialization.
At the grassroots level, local transport links – whether provided by road, rail, or water transport – are essential if local communities are to sell their produce in neighbouring markets and purchase a range of manufactured goods with the proceeds. The existence of local transport links makes possible specialization of production according to comparative advantage and facilitate the emergence of a local and regional economy.
In the conditions of a market economy, the need to improve the quality of transport services using advanced transportation technologies and the provision of fundamentally new competitive transport services comes to the fore. This is primarily due to the presence of real competition between different modes of transport.
Transportation logistics between the Far East and Western Europe is vital for the world’s economic development, but today we do not have reliable technologies and transport lines. Due to this, it is necessary to think on few aspects, which may determine the development of environmentally friendly economies in future:
- reliable transportation (safe and environmentally friendly);
- cheapest modes and transhipment lines;
- fastest modes of transportation.
Currently, about 98% [Vinokurov,2019] of mutual Far East-West Europe deliveries are made by maritime transport, with aviation transport and railway transport accounting for 1.5 – 2% and 0.5 – 1%, respectively. Approximately 80% of Far East-West Europe cargoes are carried in containers, including about 90% of cargoes brought to West Europe from the Far East (imports) and 70 – 75% of cargoes carried from West Europe to the Far East (exports) [MAERSK, n.d.].
This data shows that investment in rail infrastructure is leading to rail being a viable alternative to both sea and air for trade between the Far East and Europe.
On a global scale, sea transport delivers over 80% of all world cargo [Eurostat, 2021]. In fact, sea transportation plays a major role in world trade. In addition, from an economic point of view, this is the most efficient and inexpensive way to transport cargo.
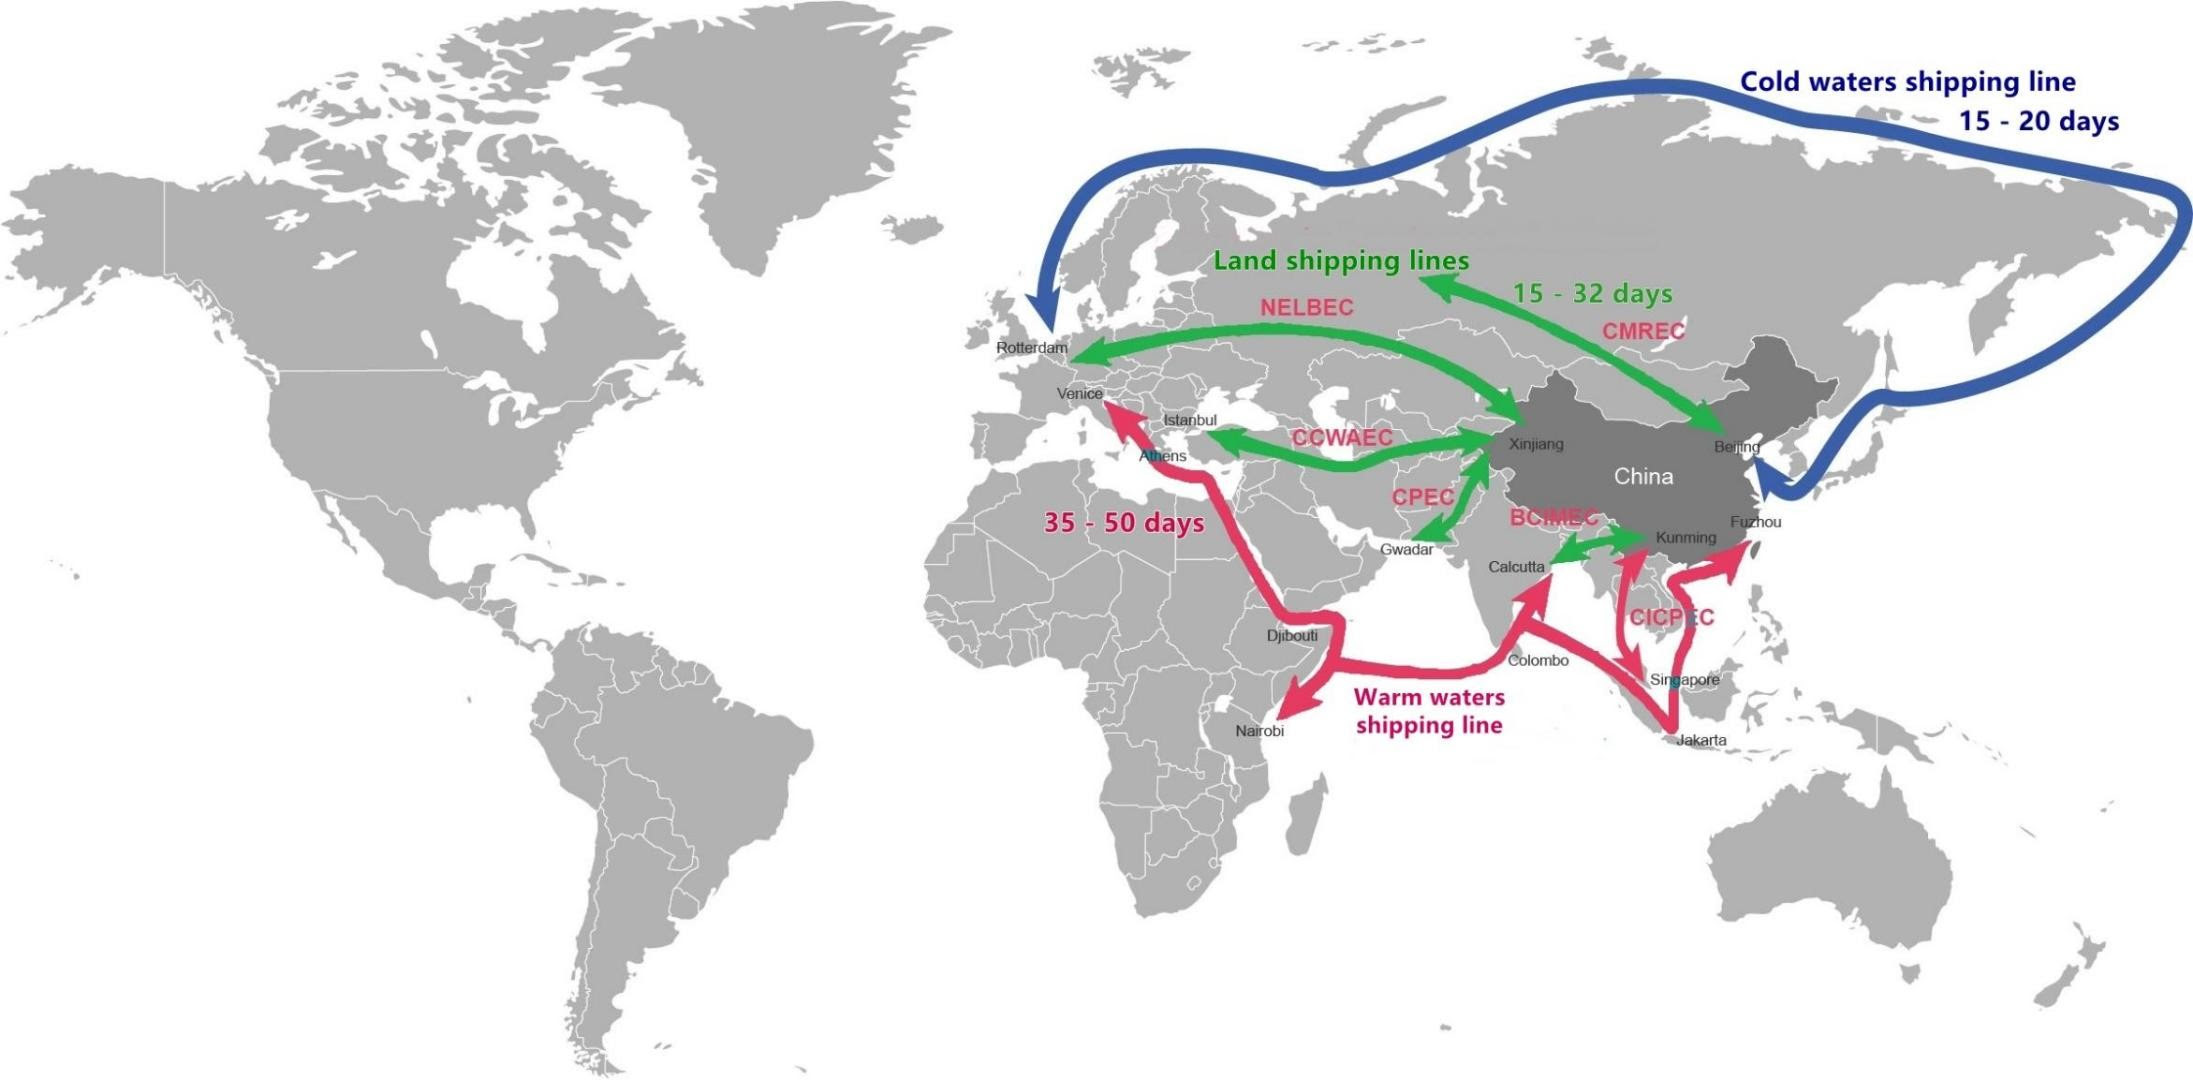
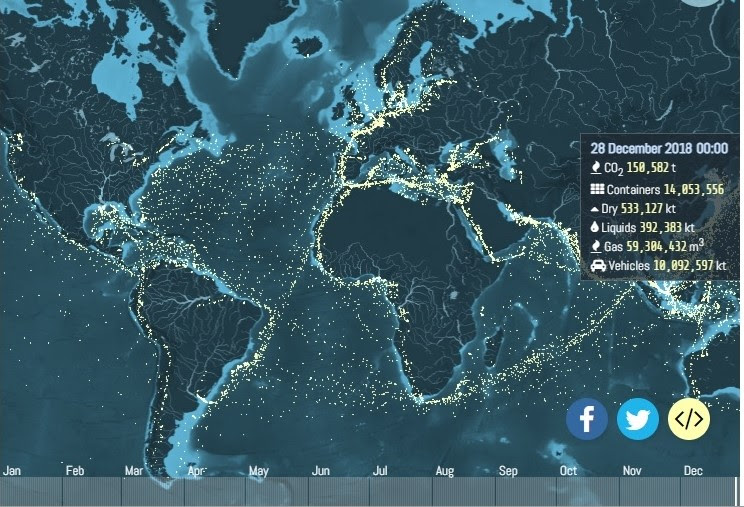
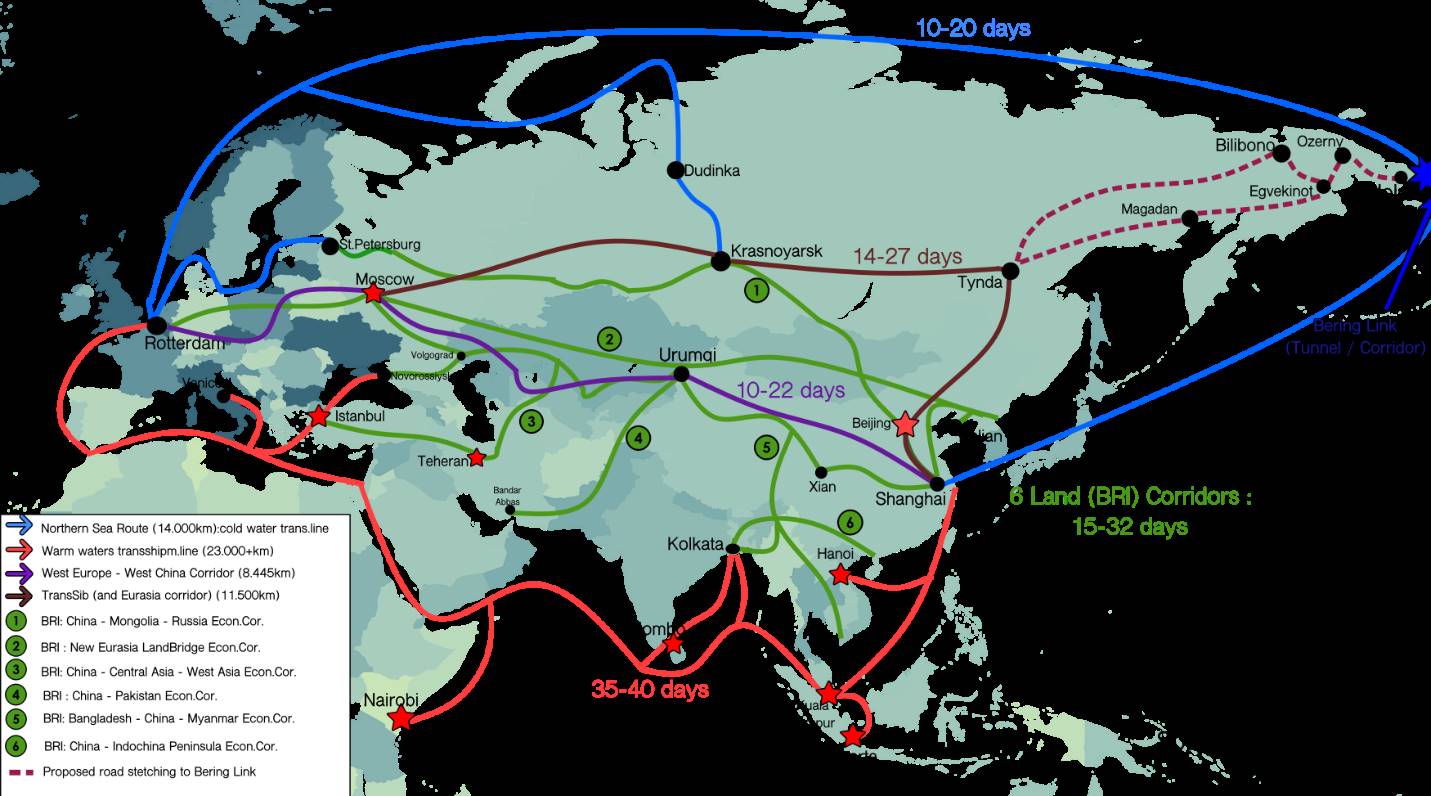
In accordance with Map 1, for now, the most beneficially is the land (green) shipping line. Since Maritime (warm waters – red) transport delivery speeds remain rather low (including those of modern container ships).
Vessels travelling along the Eurasian transhipment route run at 20 – 25 knots, while the average total travel time, including the Suez Canal passage and port calls, is 35 – 45 days. Besides, there always remains the risk of delays for natural and other reasons (such as waiting for loading at the port of departure).
Despite this, the regularity (rhythmicity) of maritime container traffic between the ports of the Far East and Western Europe is rather high. For example, Maersk Line alone makes six runs per week. However, when using the sea route to carry containers between the Far East and Western Europe, one must consider not only the actual travel time (4 – 6 weeks) but also the time required for consolidation of cargoes in ports (about 1 week) [Smotrytska, 2021a].
It is estimated [Elsevier, 2019] that cargo, currently carried by maritime and air (white shipping line) modes between Europe and the Far East, will in the future shift to rail because of improved services attributed to the Eurasian transhipment lines. It is indicated that around 2.5 million TEUs could transfer to rail from maritime transport, and 0.5 million from air transport, by 2040, which is equivalent to 50 to 60 additional trains daily, or 2 to 3 trains per hour, in each direction.
Maritime transhipment lines
Maritime routes are corridors of a few kilometres in width connecting economic regions and overcoming land transport discontinuities. International maritime shipping routes are forced to pass through specific locations corresponding to passages, capes, and straits. These routes are generally located between major markets such as Western Europe, North America, and East Asia, where an active system of commercial trade is in place.
To date, there are several maritime transhipment routes that create a global transport logistics chain:
- The busiest North Atlantic route connects the ports of the Atlantic coast of America with the ports of Western Europe
- The second busiest route passes through the Suez Canal.
- The third-busiest route is through the Panama Canal.
- West African routes connect the Atlantic ports of Europe, North and South America via the Cape of Good Hope with the West and South – East coast of Africa. Supertankers with oil from the Middle East to Europe follow the same route.
- South American routes through the Strait of Magellan connect Europe and the Atlantic coast with Brazil, Uruguay, and Argentina.
- Routes in the North Pacific Ocean connect the Pacific coast of the USA and Canada with Japan and China [CFC, 2021].
- Routes through Honolulu, Samoa, and the Fiji Islands, and through Tahiti and the Society Islands connect the Pacific coast of the USA with New Zealand and Australia.
- The Northern Sea Route
This unique transport artery is the shortest shipping route between Europe and Asia. The total length of the Northern Sea Route from the Kara Gate to Providence Bay is 5.600 kilometres, and the distance along the Northern Sea Route from St. Petersburg to Vladivostok is a little more than 14.000 kilometres [Kiiski, 2017] (See Map 2).
The mentioned maritime transhipment routes create global freight circulation and in part because of the economic activities and resources they grant more efficient access to. Their continuous availability for global maritime trade is challenging because the global trade system relies on their use. Yet, they have shaped global trade by setting up rings of circulation comprised of maritime and land corridors, notably in the northern hemisphere [AB, n.d.].
Congested Southern Seas
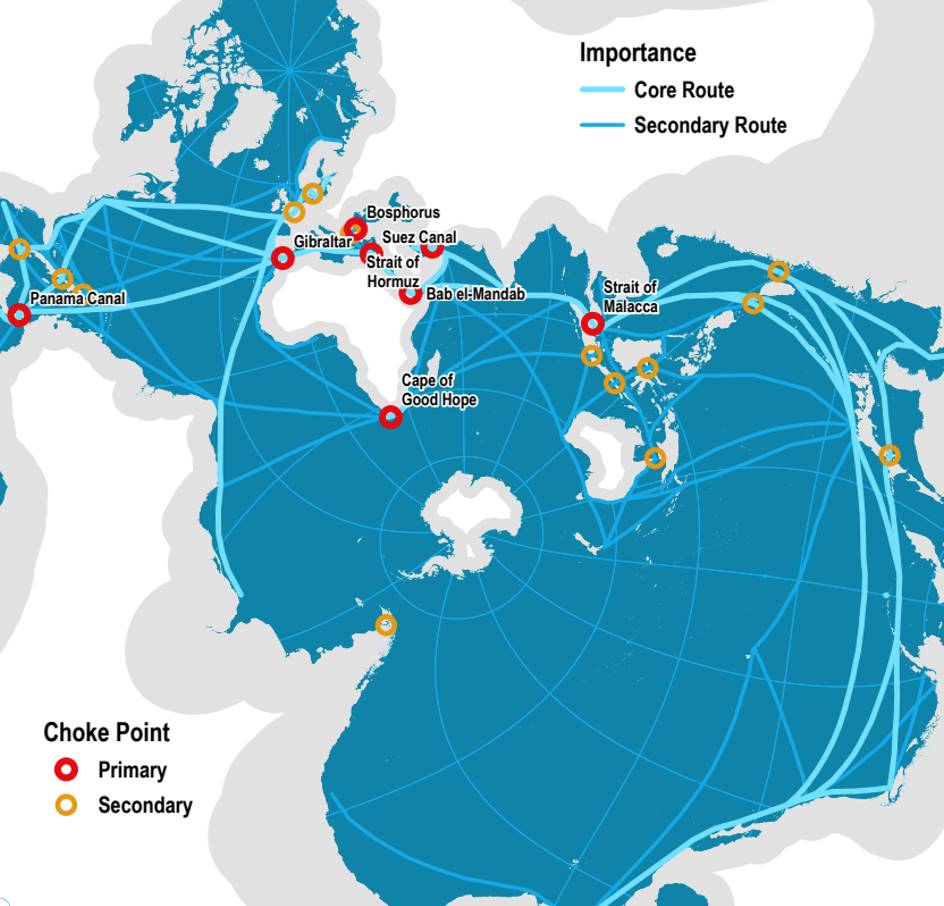
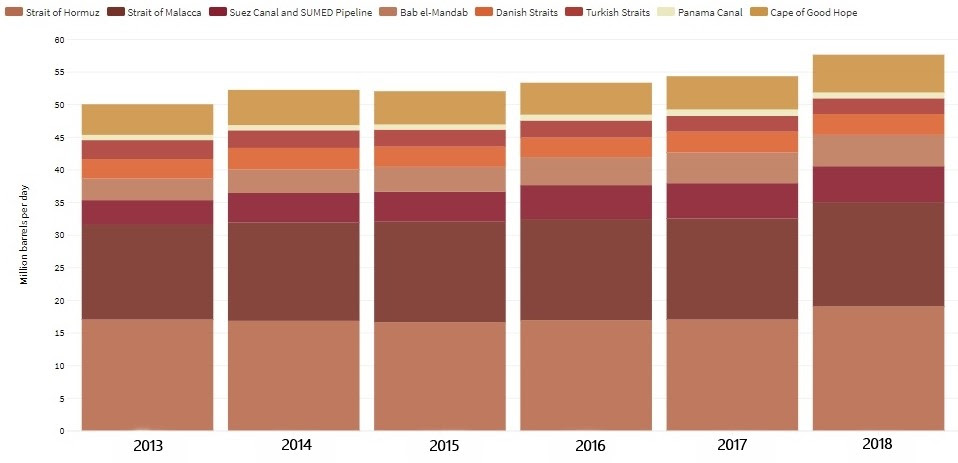
The highly frequent, stable, and inexpensive maritime transport is the cornerstone of global trade and economy, with global shipping operations being concentrated at major straits and canals, which are called chokepoints or maritime global critical infrastructures.
The traditional maritime transhipment lines, being the cheapest so far mode of transportation, present big dangers, which are making them rather vulnerable and less stable than railway roads.
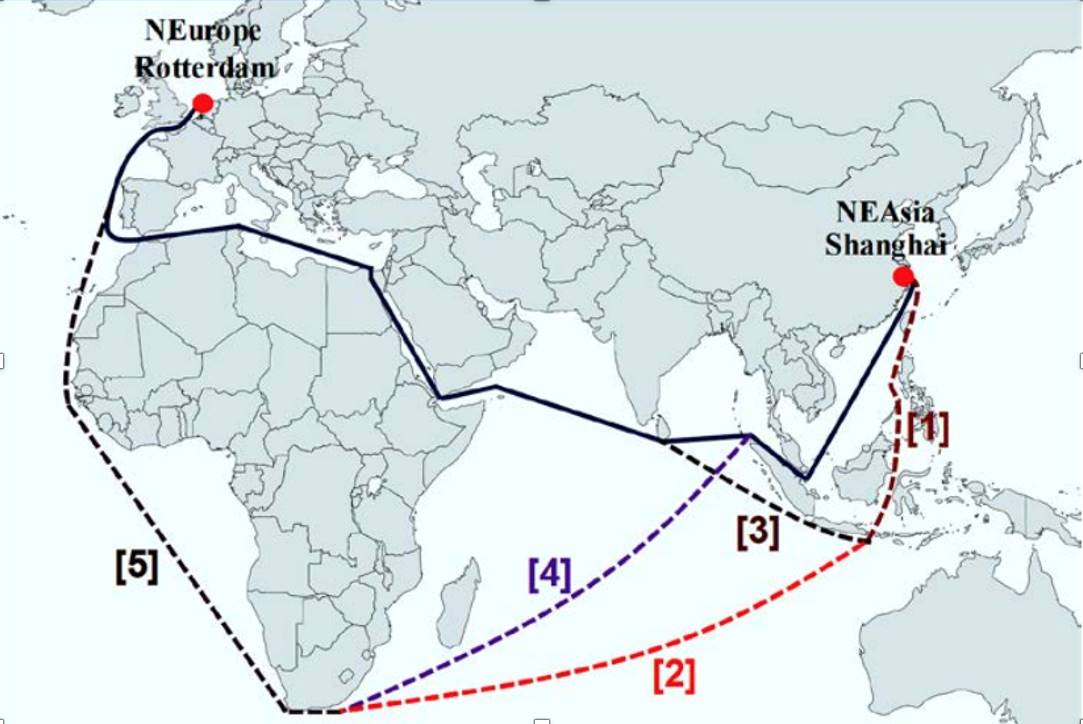
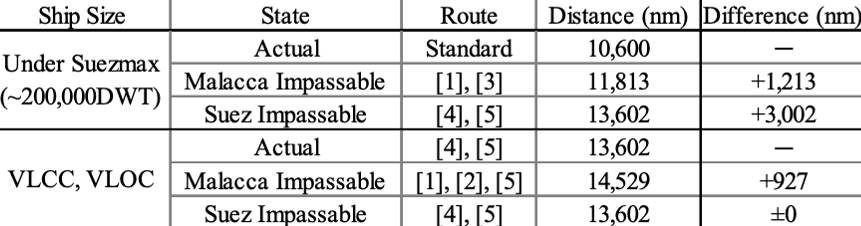
When the Malacca Strait is impassable, the detour route is passing through the Lombok strait (11.813 miles): routes #1 and #3. The Sunda Strait can be another detour route; however, it contains many navigational hazards including strong tidal flows, sandbank formations along the waterway, a live volcano, poor visibility during squalls; and the existence of numerous oil drilling platforms and small islands and reefs that may disrupt safe navigation [Mohd-Rusli,2012].
If the Suez Canal is not a viable option (e.g., very large crude carriers (hereinafter VLCCs), and very large ore carriers (hereinafter VOCs) cannot pass through the Suez Canal), the navigation route is via the Cape of Good Hope (13.602 miles): route #4 and #5. When the Malacca Strait is impassable, the detour route distance is 14.529 miles [CFC, 2021].
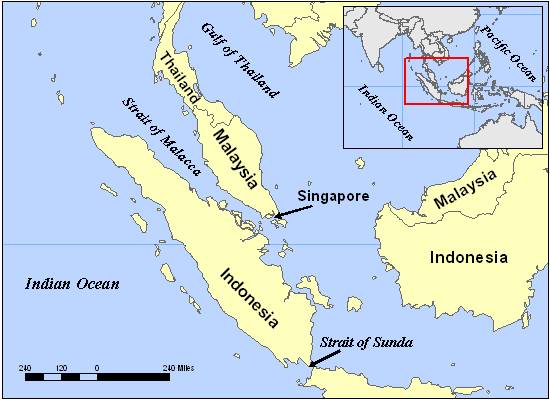
It represents the longest strait in the world used for international navigation and can be transited in about 20 hours [PEMP, n.d]. This narrow, 550-mile strait is also a major route for oil transportation, hence creating a danger of potential oil spills or collisions, significantly damaging the biodiversity and the marine environment [Tonchev, 2017].
Moreover, the SOMS is polluted not only by the oil and ships but also by enormous noise [Gençsü&Hino, 2015], influencing the marine bio-life. The transhipment line in addition is not considered as a safe pass, since it is beset with challenges, natural (during frequent squalls from the Indian Ocean, visibility can decrease considerably to make it difficult for mariners to navigate) and man-made (piracy).
The Phillips Channel in the Singapore Strait is just 2.7km wide making it another maritime zone of bottlenecks and potential oil spills (See Map 4). With so many vessels in the crowded Singapore Strait, there is often an increase of incidents [ICS, 2015].
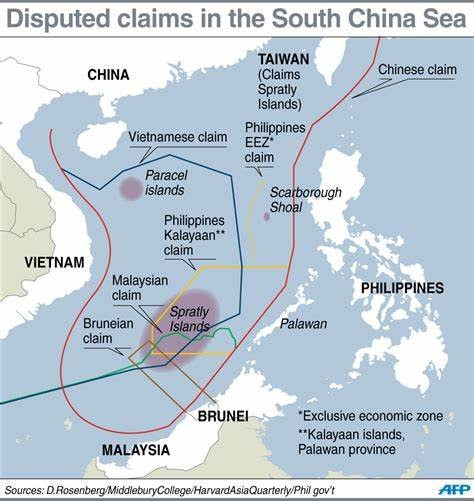
From the Straits of Malacca and Singapore, ships make their way to the South China Sea, another crucial shipping lane and a region subject to contention since oil and natural gas resources are present, also known as a zone of unstable waters in the South – East of the Indian ocean (See Map 5).
The South China Sea is a prominent shipping passage with 5.3 trillion USD (nearly one-third of all global maritime trade) worth of trade cruising through its waters every year [Gao & Lu, 2019]. Since this zone has emerged as one of the most dangerous flashpoints in the Indo – Pacific over the last decade, the transhipment here is rather unsafe, not to mention the ecological disasters which are emerging currently there.
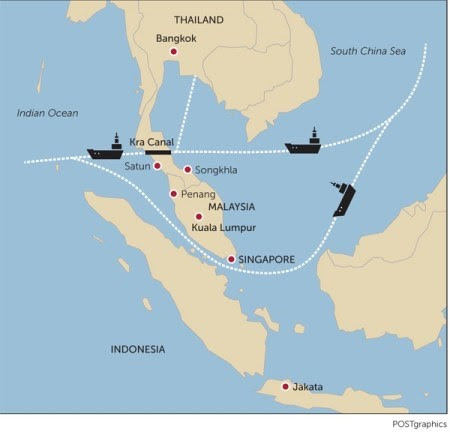
Shipping lines using the canal will need to consider the benefits of lower transit times versus the canal tolls. The canal would mainly benefit Thailand, Burma, Cambodia, and Vietnam as they would see more significant shipping time and cost reductions for their maritime trade. China is pursuing this project for commercial and strategic reasons since it will give it an additional alternative to using the Strait of Malacca [Yuan et.al., 2019].
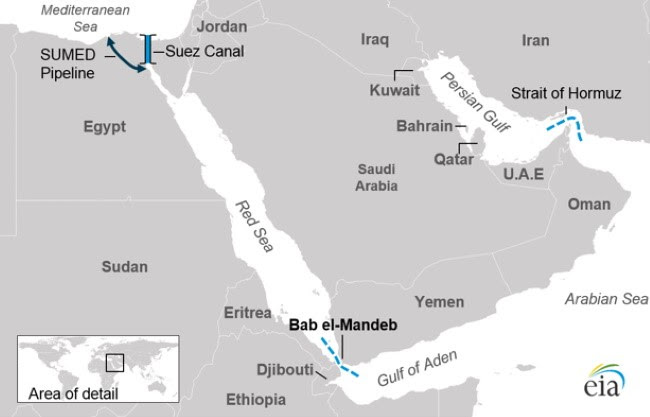
The Cook Strait is located between the two main islands that comprise New Zealand, the Cook Straight is a very useful, albeit dangerous shipping lane. The danger arises from the unpredictable waters, yet the benefits of trading between the islands are simply too big to ignore [CFC, 2021]. The Strait of Bab-El-Mandeb, one of the World’s Most Dangerous Straits (situated in the high conflict zone between Yemen and Somalia), is also the shortest trade route between the Mediterranean region, the Indian Ocean, and the rest of East Asia [Aljamra, 2019].
Oil-rich Arabian Gulf nations rely heavily on it: approximately 57 giant oil vessels from these countries pass through the strait each day, over 21.000 each year (See Map 7) [Reuters, 2019]. This fact makes the straight not only the zone of interests of main powers (and hence high tension in the region) but a big threat to the environment (oil spills).
As one of the busiest shipping lanes in the world, is also one of the most essential ones, due to the number of oil tankers that navigate these waters daily [IMO, 2014].
Around one-third of the world’s oil is transported through this strait, making it essential not only for trade but for the global economy. The same fact is making this route one of the most dangerous to the environment, considering existent oil spills or collisions [Einemo, 2015].
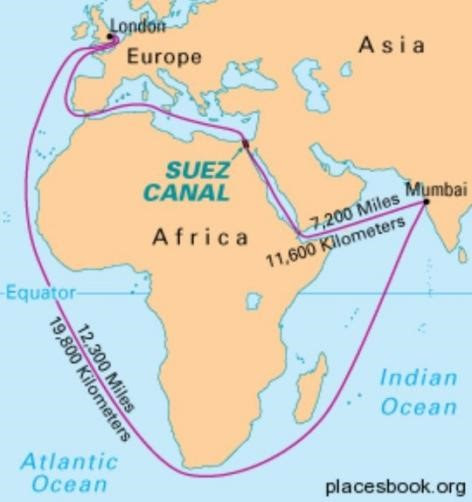
The Suez Canal (Including Gubal Strait) provides the shortest route between the Atlantic and Indian oceans (saves 7.000 Km of extra travel) (See Map 7).
The Suez Canal is an artificial waterway of about 190 km in length running across the Isthmus of Suez in northeastern Egypt, connecting the Mediterranean Sea with the Gulf of Suez, an arm of the Red Sea. The Suez Canal has no locks because the Mediterranean Sea and the Gulf of Suez have roughly the same water level, making Suez the world’s longest canal without locks. It acts as a shortcut for ships between European and American ports and ports located in southern Asia, eastern Africa, and Oceania [PEMP, n.d].
The 120-mile pass – the shortest waterway between the Indian Ocean and the Mediterranean Sea of the Atlantic Ocean. The canal allows water transport to pass in both directions between Europe and Asia without skirting Africa [CFC, 2021].
More than 100 boats travel the canal daily and 3.9 million oil barrels travel daily [TME, 2021]. Thus Around 8% of global sea-borne trade takes place through it. Despite the projects of Canal’s extension, its waters are still congested, making the users less safe, extending the time, and raising the costs of transhipments [EPC, 2015].
In recent years, services to the North American East Coast from Asia and transiting through the Suez Canal have increased to account for more than 15% of the traffic it handles. The canal area has also become a major transhipment cluster [PEMP, n.d].
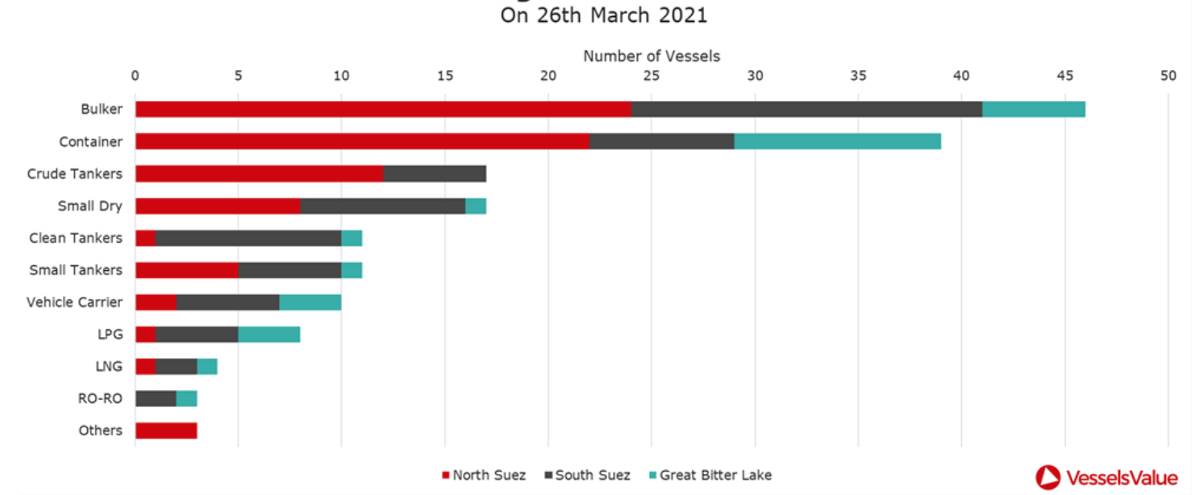
Despite this, the growing ship size transiting the canal can involve risks, such as the grounding of a 20.000 TEU containership in 2021, which blocked the canal for six days, causing global disruption, when the Ever-Given ULCV became wedged and vessels were not able to pass through one of the world’s key shipping transit zones [PN, 2021] (See Figure 3).
After its discovery by the Portuguese in 1488, the cape took the name Good Hope because it offered a maritime passage towards India and Asia, thus the hope of a fortune for those who traversed it. Vasco de Gama got around the cape in 1497 and was the first European to reach India by sea [PEMP, n.d].
Afterwards, the Cape of Good Hope became an important point of transit in Europe – Asia trade networks, including a coaling station when steamship technology was developed in the 19th century.
In March – April 2021 multiple container ships are rerouting to the Cape of Good Hope to avoid the logjam created by the Ever Given blocking the Suez Canal [PN, 2021] (See Map 8).
Considering that the trip from the Persian Gulf to Port of Rotterdam takes nearly 18 days via the Suez and more than 31 days via the Cape of Good Hope for a ship travelling at 15 knots [Essallany et.al.,2019], the alternative made it possible to save cargos from being stuck in the waters of Red sea, but also greatly impacted trade turnover between countries (See Map 8).
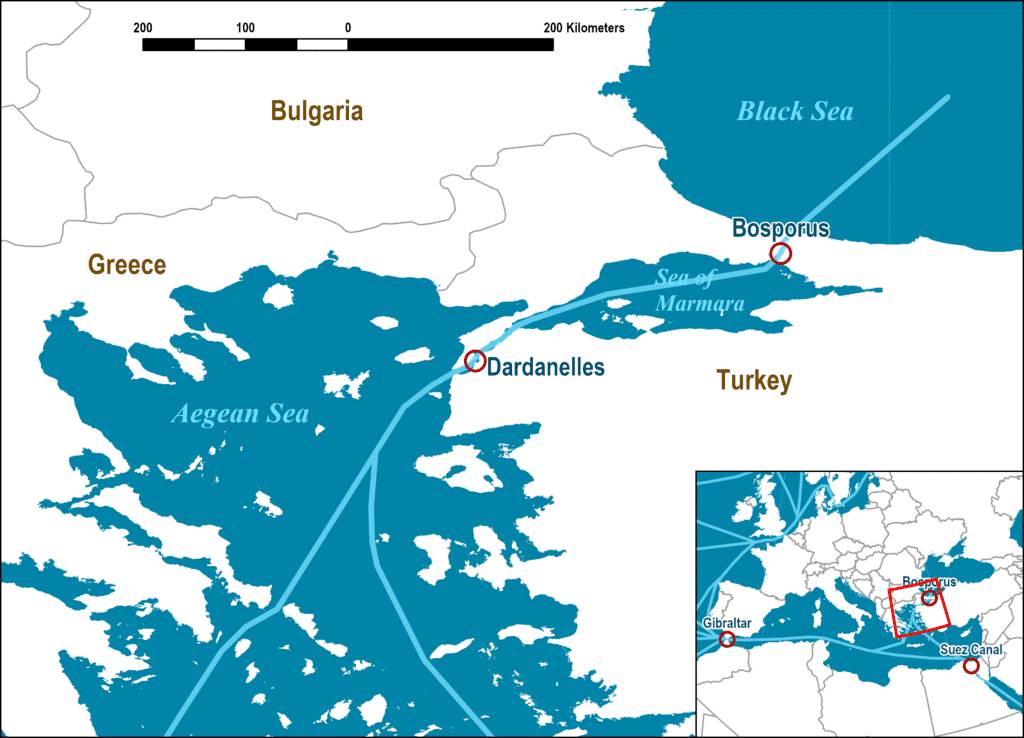
The Bosporus and Dardanelles Straits separate the Sea of Marmara from the Aegean and Black Seas (See Map 10). Both straights are on the Europe – Asia boundary and lie within Turkey.
The Bosporus is located on the northern edge of the Maramara and southwestern edge of the Black sea. Turkish Straits provide the only access between the Black Sea and the Aegean Sea. The Dardanelles, on the southern tip of the Marmara and northeastern coast of the Aegean Sea (which is connected to the Mediterranean), is wider than its northern counterpart [AP, 2011].
Both Straits between Europe and Asia Minor, connecting the Black Sea with the Strait of Marmara, form a significant route between Europe and Asia, along which oil is transported, as well as commercial and military trade [CFC, 2021].
More than 40.000 vessels are passing through these waters per year, transporting almost 650 million tons of cargo [Ergocun, 2020]. Located in the area of the conflict of the power’s interests, this zone has been always considered vulnerable in terms of safety, not to mention significant damage of local maritime bio life.
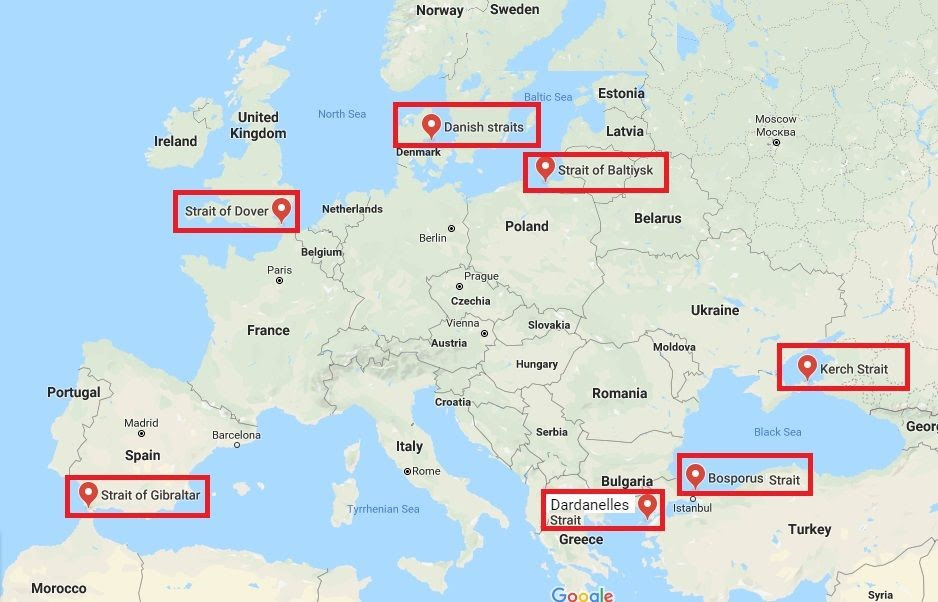
The Oresund Strait is a passage of 115 km between Denmark and Sweden connecting the North Sea and the Baltic. Currently, it is a maritime dead-end, which has possible options to be further merged with the Northern Sea Route (after completion of Arctic railway). It enables Russia, the Baltic States, Poland, and Germany to access international maritime shipping. The majority of Russian container trade transit through the strait [Ducruet, 2016].The Danish Straits are a system of straits between the Scandinavian and Jutland Peninsulas. It includes the straits of the Small Belt (the smallest width is 0.5 km), the Big Belt (3.7 km), the Ehresund (10.5 km), Kattegat (60 km) and Skagerrak (110 km).) [PEMP, n.d] (See Map 11).
It is a shipping channel connecting the Gulf of Panama of the Pacific Ocean with the Caribbean Sea and the Atlantic Ocean, located on the Isthmus of Panama on the territory of the State of Panama. The Panama Canal has an invaluable impact on the development of shipping and the economy in the Western Hemisphere and around the world [IntlReg, 2021a]. The geographical position has led to its extremely high geopolitical importance.
It currently allows ships carrying 14.000 TEUs or less to pass [MW, 2020]. It is estimated that more than 14.000 ships pass through the canal each year. Despite the numerous projects to widen to double the capacity by adding a new lane of traffic, the waters of the Canal are still dangerously congested, influencing not only the cost and time of transhipment but also damaging bio-systems [FAO, 2014].
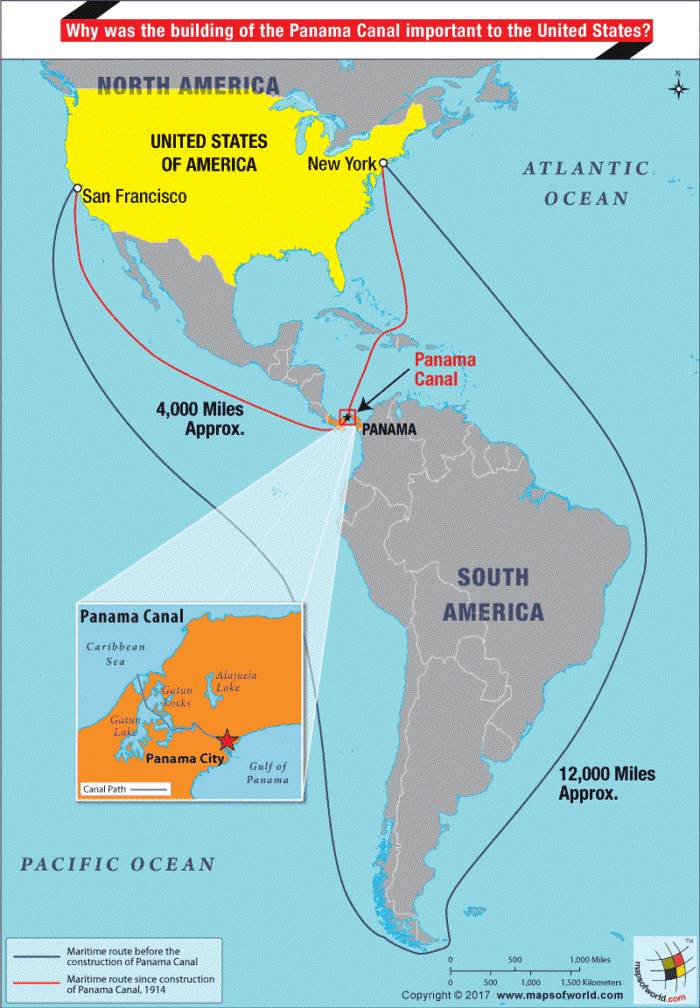
With the construction of the Panama Canal in 1916 and later on the setting up of the North American transcontinental bridge in the 1980s, this passage lost most of its strategic importance, a marginalization reinforced by limited economic activity at the southern tip of South America [PEMP, n.d].
The Strait of Florida is serving as the main connection between the United States and all points to the south and west, the Strait of Florida is very busy. This shipping lane allows ships to pass from the Atlantic Ocean into the Gulf of Mexico, thus catering to the Caribbean and Central America.
The St. Lawrence River is a major waterway in North America, flowing through the United States and Canada and connecting the Great Lakes with the Atlantic Ocean. At the mouth, the width of the river reaches 130 kilometres. The length of the river is 1.197 km, the basin area is 1.344.200 km2 [Ducruet, 2016] (See Map 13).
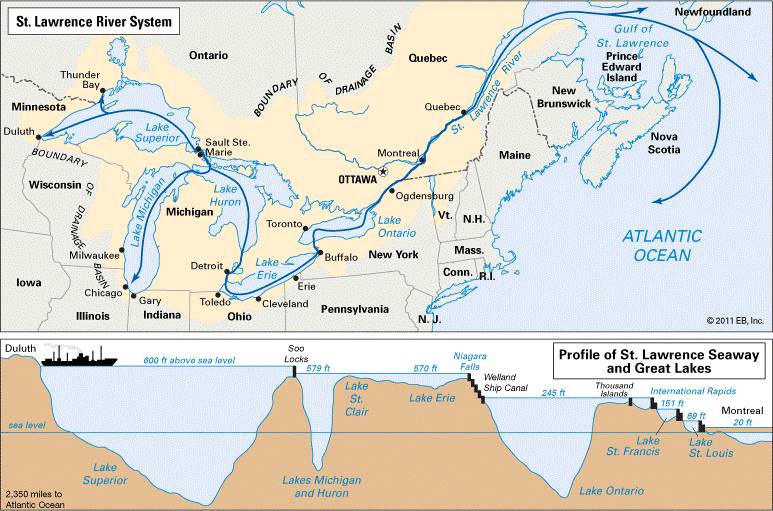
Among more than 150 ports along the entire length of the waterway from the Atlantic Ocean to Lake Superior, such as Quebec, Montreal, Toronto, Hamilton, Sault Ste-Marie, Buffalo, Erie, Cleveland, Detroit, Chicago, and Duluth Superior [PEMP, n.d].
Ships from various parts of the world annually deliver millions of tons of cargo along the St. Lawrence River. The use of this river system creates tens of thousands of jobs and generates billions of dollars in revenue annually.
Thus, it can be traced that the current sea arteries of warm waters are not just seriously congested (See Map 14), but also dangerous not only for the ecology and because of security reasons (robbery, piracy etc) (See Figure 4), but also for the stable development of trade and economy. The consequences of these dangers may be fatal in a few years unless the measurements of improving the maritime transhipment infrastructure are not taken.
The Strategic North
Global warming is causing vast perennial ice sheets to melt, resulting not only in an environmental threat but also in the opening of economic opportunities.
Today, considering the melting of ice in the Arctic Ocean, we can talk about the emergence of another alternative to the main transcontinental routes that run through Eurasia (green land shipping line), air (white shipping line) and the warm southern waters of Eurasia and further to Africa via Suez Canal (red shipping line).
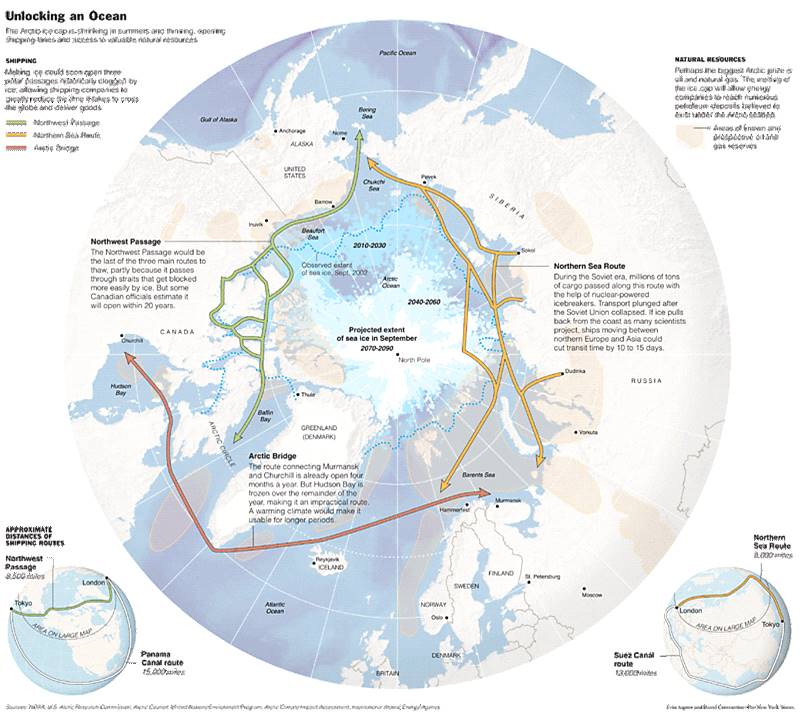
The rapid melting of the north polar icecap opens the prospects of shortened transport waterways in the ice-free areas. There are basically three possible routes, each of significance:
- the Northwest Passage, connecting the American Continent and Far East Asia;
- the Northern Sea Route, offering a shorter way from Europe to Asia along the Russian Arctic coastline; and
- the Arctic Bridge, connecting Canada and Russia (See Map 15) [Bajrektarevic, 2010].
Geographically the position of the North waterways is very beneficial. The Northwest Passage connects the Atlantic and Pacific along the northern coast of North America through the Arctic waters from the Davis Straits and the Baffin Bay all the way to the Bering Sea shortening the distance between Far East Asia and the American East Coast (via Panama) by approximately 7.000 kilometres [Powell, 2018].
The North-East Passage, which connects the Atlantic coast of Western and Northern Europe with the Pacific coast of Northeast Asia via the Russian Arctic coastline, is cutting the distance between the edges of two continents, making it shorter by about 40% in comparison to the traditional, warm seas transport routes via the Suez or Panama Canal.
The Arctic Bridge is a seasonal route that shortens the connection between the North American and European continents via the Arctic Ocean. Observation shows that the transhipment route between the North Atlantic and the Pacific Ocean straight over the Central Arctic Ocean (the so-called Arctic Bridge) might be in reach earlier than expected due to climate change. In this case, Iceland’s strategic position will change dramatically and could turn the island into an economic hub – a power base for transportation-related services, bringing along a whole new range of economic activities to Europe [Pompeo, 2019].
Thus, in terms of logistics, the cold waters shipping line (blue – Northern sea or Arctic passage) will allow delivering cargo to Europe by sea faster than the 48 days (that it takes on average) to travel from the Northern parts of the Far East to Rotterdam via the Suez Canal, considering that the passage of a cargo ship from Shanghai to Hamburg along the North Sea route is 2.8 thousand miles shorter than the route through Suez Canal. (e.g., in 2019 the Russian Arctic gas tanker “Christophe de Margerie” reached South Korea from Norway without an icebreaker escort in only 15 days) (See Map 1) [Smotrytska, 2021a].
Also, the traditional route by the Suez Canal loses to the route around the Cape of Good Hope, around Africa. By now, it has become clear that there are no practical reasons to talk about the competition of the Northern Sea Route with the Suez Canal in terms of the volume of cargo transported (due to limited usage of the NSR).
In general, by the end of 2019, about 18.600 ships passed through the Suez Canal, compared to 18.200 thousand units in 2018. Net tonnage reached 1.2 billion tons – an increase of 5.9%, the revenue of the administration amounted to 5.8 billion USD [Smotrytska, 2021b].
Among the advantage of Northern Seas transhipment lines, one should consider significantly lower risks of physical loss of cargo (due to the peculiarities of the climate of the Indian Ocean, through which the southern route passes).
Tropical storms of the Indian Ocean, which cause significant destruction, and sometimes sinking of cargo, lead to significant financial losses, and sometimes to the loss of a deal with the buyer. Such tropical cyclones occur during the typhoon season and last for more than six months: from May to November [Lu et al, 2014].
The climatic features of the southern route suspend the navigation of the canal for as long as 6 months, creating unsafe and in some cases unprofitable conditions for transport companies. There are no storms in the sea expanses of the Northern Sea Route almost all year round, this is facilitated by the ice cover, which restrains water fluctuations. Thus. the stormy conditions of transportation of the northern seas are incomparable with the destructive storms of the South.
Another advantage, which plays into the hands of the blue transhipment routes is the decrease of use of harmful to the environment material – cement. Building new land infrastructure (especially roads) requires cement, a material that contributes more than 6% of global carbon emissions [Tonchev, 2017]. Shifting the transportation mode to the sea, therefore, will reduce the amount of roads constructions on the land.
In addition to the time criterion, a cold water shipping line is beneficial in terms of capability. It is usually characterized [Liua&Kronbakb, 2010] as the shortest sea route between Europe and Asia, the safest (e.g., the problem of Somali pirates) and has no restrictions on the size of the ship, unlike the route through the Suez Canal.
Thus, the Arctic route will allow to delivery of cargo to Europe faster by sea, reducing the route by 20 – 30%, and hence being more environment friendly (by using less fuel and decreasing CO2 emission) and saving human resources [IntlReg, 2021d]. Nevertheless, capitalizing on that opportunity requires much work in terms of improved navigation procedure and installation of safety-related infrastructure (See Figure 5).
But the shortening of the transhipment routes and hence slight decreasing of CO2 emissions will not solve the problem completely. The global environmental issue of CO2 consumption should be treated starting from the main root of the problem and in regards to it, the Arctic may play the key role [GovC, n.d.].The region covered by new transhipment routes (esp. South-Eastern Europe, Eurasia and South-Eastern Asia covered by Eurasian transhipment lines) has significant potential to be powered by solar energy.
Thus, it is estimated that less than 4%of the maximum solar potential of the region could meet the countries’ electricity demand for 2030 which gives the world a possible solution to reduce the countries’ need for fossil fuels as they develop [Smotrytska,2021a].
Only in Europe, due to the implementation of renewable energy projects (e.g., Francisco Pizarro plant in Spain, Nikopol Solar Power Plant, Ukraine, Cestas Solar Farm in Bordeaux, France etc), the solar capacity increased by 36% to 8 GW in 2018 [EC, 2020]. By 2020, several member states in the European Union pushed to meet their 2020 renewable energy targets.
Along with solar projects, wind onshore wind farms projects (e.g., the southeast region of Ukraine, the Fantanele – Cogealac wind park, Romania etc.) are also destined to meet increased national energy needs in the wake of phasing out fossil fuel power plants. Thus, the renewable energy potential and cooperation opportunities is a chance for the countries to leapfrog from their carbon-intensive trajectories to low-carbon futures.
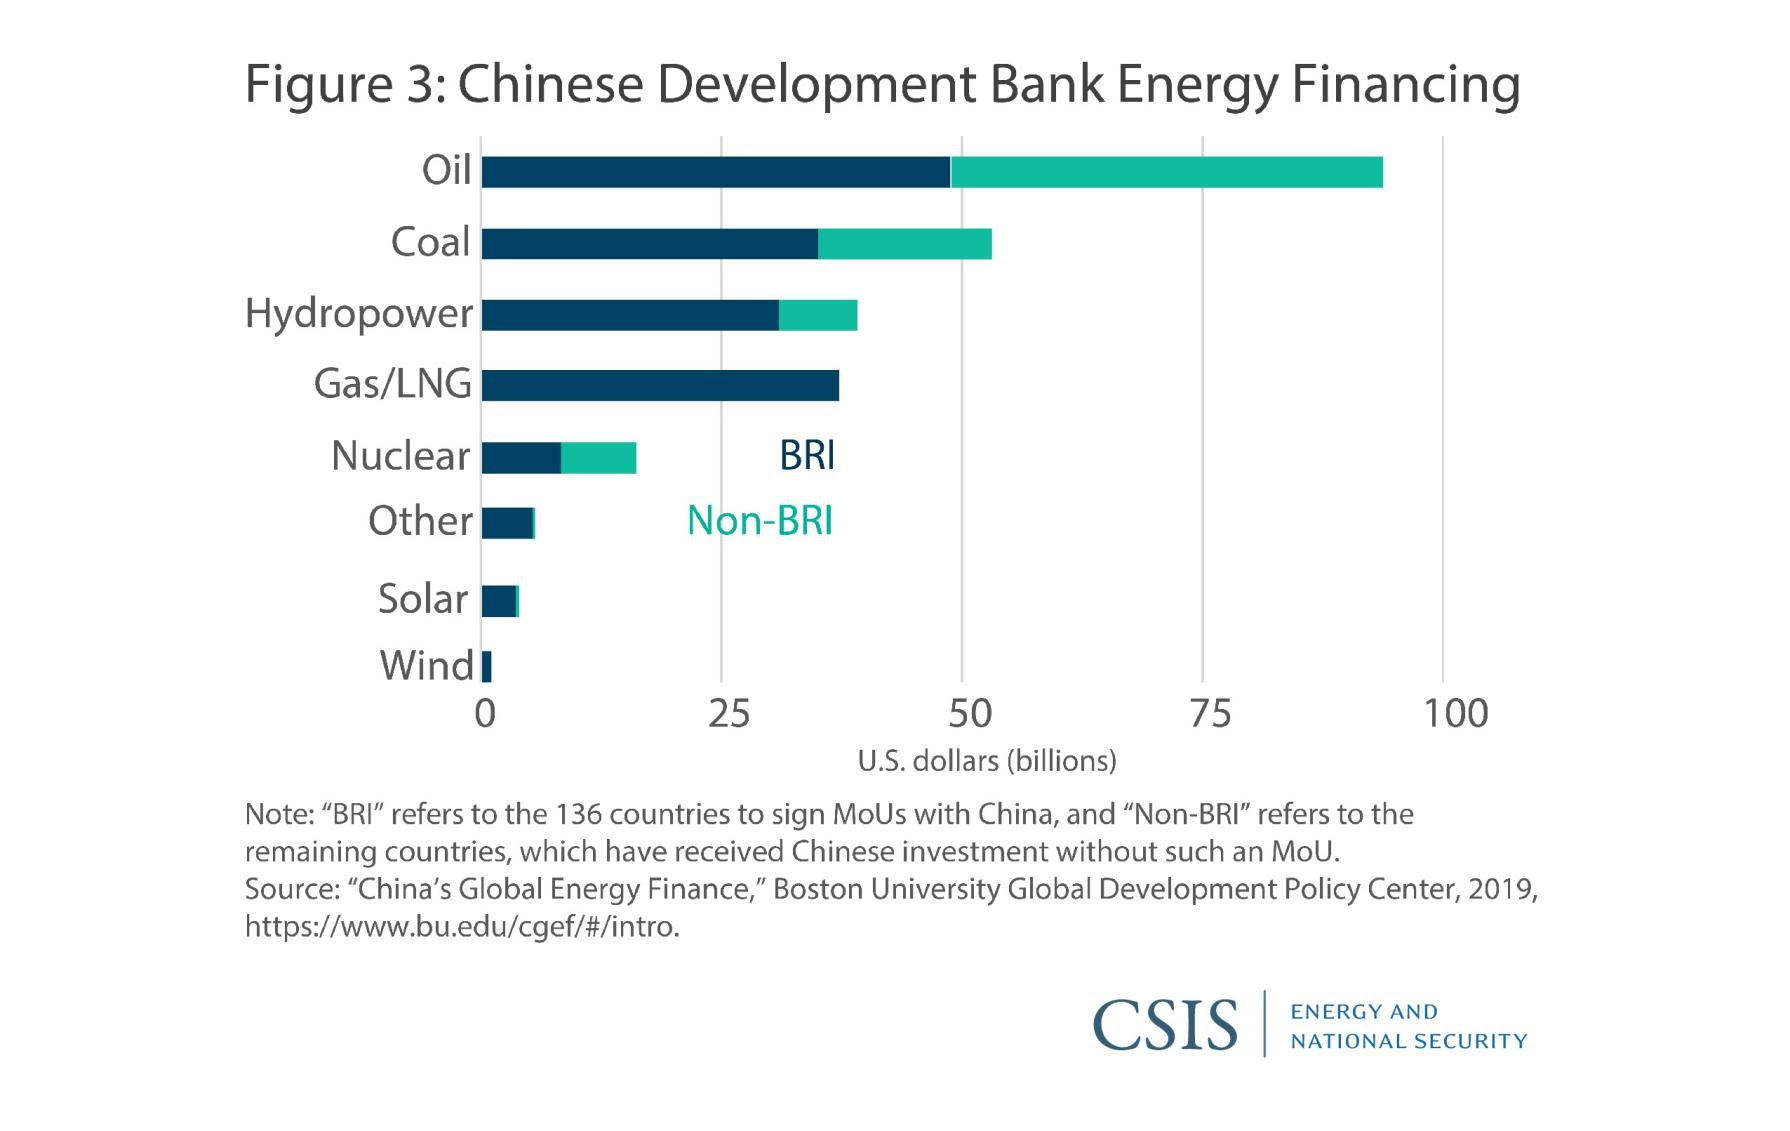
The projects launched in the Arctic (e.g., project Yamal LNG) meets the goal of reducing the share of coal in total energy consumption in the world’s largest greenhouse gas emitters below 58% by the end of 2020 [ICIS, 2017], as this project allows to diversify countries’ energy sources, contributing to its withdrawal from coal use. This, in turn, reduces CO2 emissions within the country and may contribute to the implementation of the same scheme in the framework of the building of the transhipment routes [UNEP, 2011].
The goal to reduce dependence on coal and fossil fuels requires a huge surge in the use of natural gas, and the adoption of renewable energy [IRENA, 2015]. Is resulting in not only infrastructure constrictions but also the development of the projects connected with energy (See Figure 6).
One of the key factors driving the implementation of this project is that, unlike traditional fossil fuels, renewable energy sources are widely available around the world [OGV, n.d.]. Whether it is solar or wind power, tidal energy or hydroelectric plants, most countries have the potential to develop some clean energy.
But in order to use the energy potential of the Arctic, the countries of the region are making additional efforts to develop the main transhipment routes of the North, and one of them – the Northern Sea Route – has great prospects.
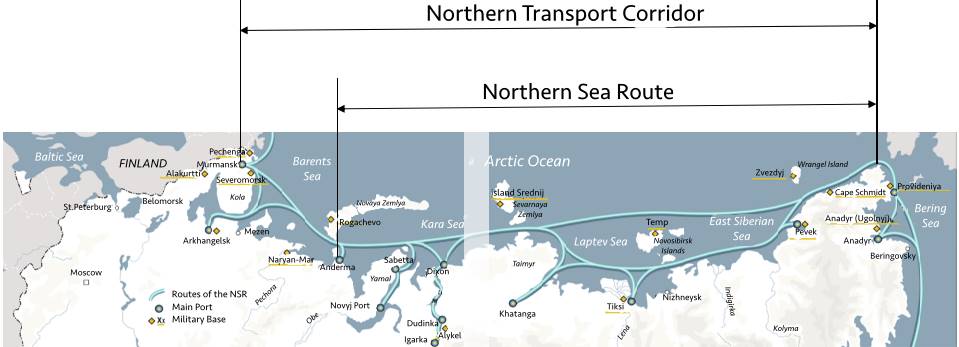
The Northern Sea Route is the shortest sea route between the European part of Russia and the Far East; it passes through the seas of the Arctic Ocean (Barents, Kara, Laptev, East Siberian, Chukchi) and partly the Pacific Ocean (Bering) (See Map 16).
The length of the route from St. Petersburg to Vladivostok via the NSR is only 14.000 km, while on the more popular route through the Suez Canal it is more than 23.000 km. Also, this route is advantageous in terms of delivery time and route length for many countries of the East Asian region to the countries of Western and Northern Europe.
For example, the distance from the port of Rotterdam in Europe to the port of Yokohama in Japan via the Suez Canal exceeds 11.100 nautical miles, while the length of the route along the Northern Sea Route is only 7.000 nautical miles, that is, more than 37% shorter. The Northern Sea Route is also beneficial to other ports, for example, the route from Hong Kong, Shanghai, and Busan (South Korea) to Rotterdam is shorter by 11%, 24% and 29%, respectively [Kiiski, 2017] (See Map 17).
The Northern Sea Route serves the ports of the Arctic and major rivers of Siberia (import of fuel, equipment, food; export of forests, natural resources).
Now, this sea trade route is not too busy, however, according to experts, it is very promising, and in the future, it will become one of the most popular in the world [Jiang et. Al, 2018].
The only serious obstacle hindering the development of the Northern Sea Route for maritime transportation is difficult climatic and ice conditions since most of the NSR passes through zones of thick long-term ice.
Nevertheless, as a result of global warming and, as a consequence, the massive melting of the Arctic ice, the Northern Sea Route opens up new opportunities for navigation along the northern shores of Eurasia. An example of this is the Chinese cargo ship Yong Sheng of Cosco Group, which left the port of Dalian for Rotterdam on August 8, 2013 [RT,2013].
It arrived at the Dutch port on September 10, delivering about 19.000 tons of metal products. The ship completed the entire route in 34 days. For comparison, the journey through the Suez Canal takes an average of 48 days. Thus, Yongsheng became the first Chinese cargo ship to make a commercial trip along the Arctic route [CFC, 2021].
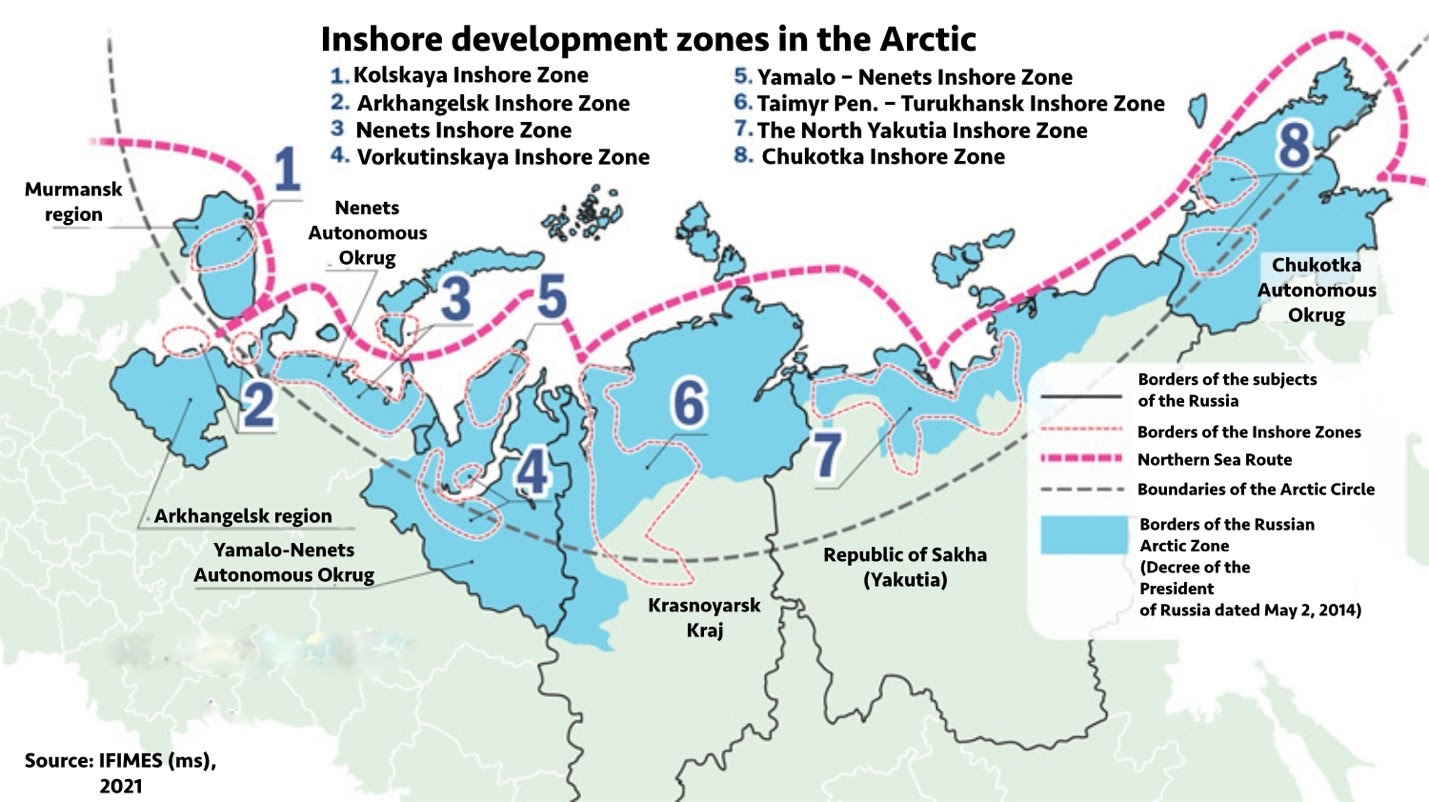
It should be noted that the main prospects for the development of the NSR are related to the implementation of the Decree of the President of the Russian Federation dated 07.05.2018 No. 204 “On national goals and strategic objectives of the development of the Russian Federation for the period up to 2024” [MTRF, 2019].Already in 2020, the Russian authorities were intended to increase the volume of cargo transportation along the NSR to 40 – 43 million tons of cargo. According to the decree of President V. Putin, in 2024, the level of transportation should reach 80 million tons. Under favourable circumstances, by 2030 the size should exceed 100 million and amount to about 120 million tons. The growth is planned to be ensured by the beginning of the supply of Taimyr coal to India. After 2030, there are several plans to significantly increase the volume of international transit traffic through the Northern Sea Route [MTRF, 2019].
Though conditions are better along the NSR than elsewhere in the Arctic, major improvements are still needed in support of navigation as well as better communication considering increasing trans-Arctic traffic on the NSR.
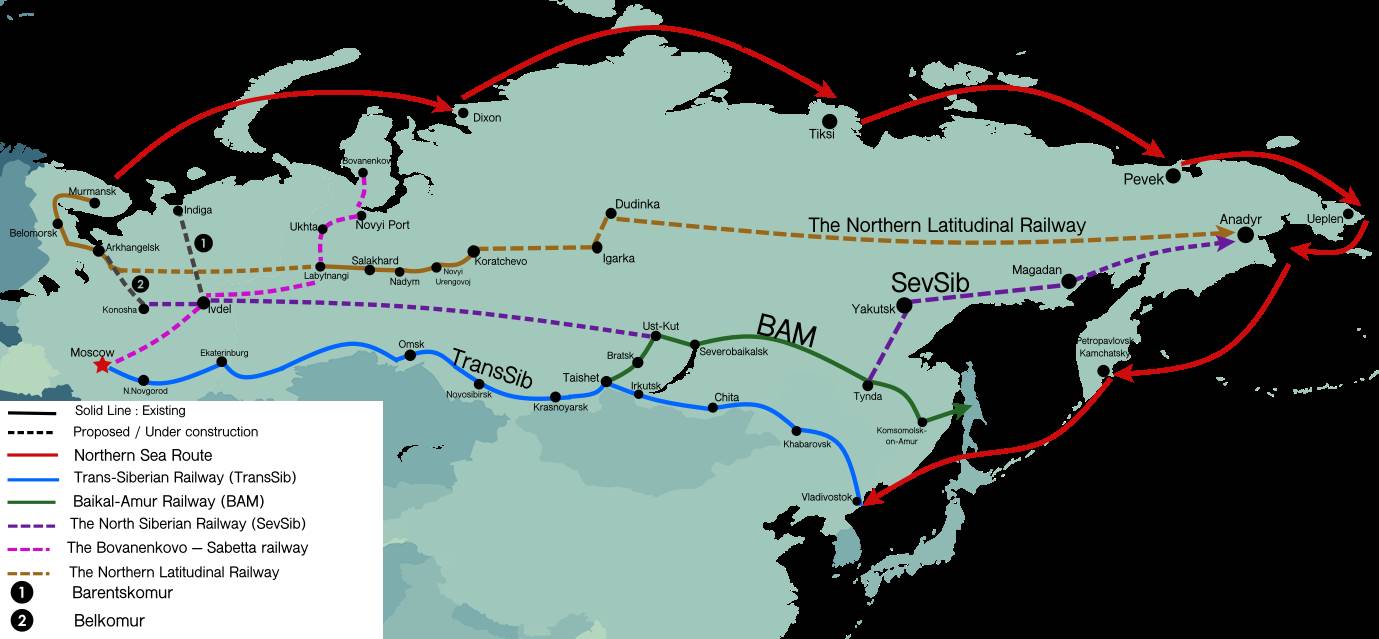
Thus, the NSR will be most effectively used together with a network of high-speed railways connecting the east and west of the country and providing access to the deep regions of Russia to the ports of the Arctic and Pacific Oceans (See Map 18). The NSR and the supporting frame of railways are also important for strengthening the transport connectivity of the continents.
In the American part of the Arctic region, the construction of the northern components of fixed transportation link in Alaska and Canada opens up development programs with massive international implications, linking the United States with East Asia in the creation of a high-technology, fusion- and fission-powered backbone for a new world economy.
The proposed Alaska – Alberta (A2A) rail corridor will connect the US state of Alaska with Alberta, Canada [Railway Technology, 2020]. The route will link the deep-water ports and the existing railway network of Alaska to the Canadian railway system
Apart from this, considering the current development of logistics routes in Eurasia, the issue of building the Eurasia – America transport corridor via the Bering Strait, which is the missing link in the global transport system, is of crucial importance for the further development of the world economy in the context of globalization.
Thus, the development of a new logistics hub of the world’s transcontinental routes will contribute to a significant increase in the economic well-being of the regions of the Far East, Eurasia, and North America, which will receive additional infrastructure and economic development (See Map 19). In addition, with the help of the new road network, the development and trade of minerals from the Far East to other regions of the world will be simplified.
Equally important are the initiatives of the countries of Northern Europe and China in the development of transport logistics of the North, which ultimately aims to link the railway network of Eurasia (Russia, Chinese BRI and European TEN-T) with the maritime transport artery of the Northern Seas.
While there is a stable fixed ling between Sweden and Denmark (the 16-kilometre-long Øresund Link between Malmo, Sweden (right), and Copenhagen, Denmark (left), was completed and opened to traffic in 2000), the stable transportation connection across the entire Scandinavia is not fully developed (especially in the Gulf of Bothnia and Baltic Sea), creating a gap between the countries of the North Sea and Baltic states [UNCTAD, 2016]. To fulfil this missing part of the logistic chain, North European countries are considering the creation of new transportation fixed links in the region:
- The “HH Tunnel” between Denmark and Sweden;
- The Arctic railway line with the “Arctic Link” to China via NSR to Northern Europe;
- The Arctic Railway to boost railway connectivity North Europe;
- The Pol-Corridor fixed link;
- The International North-South Transport Corridor (hereinafter INSTC) from Finland to Norway and further South;
- The Helsinki – Tallinn undersea tunnel between Finland and Estonia;
- The Nordic Logistic Corridor (NLC);
- Baltic Sea Bridge within Kvarken Multimodal Link between Sweden and Finland;
- The Rail Baltica railway project to enhance railway links between the Baltic States and Central Europe
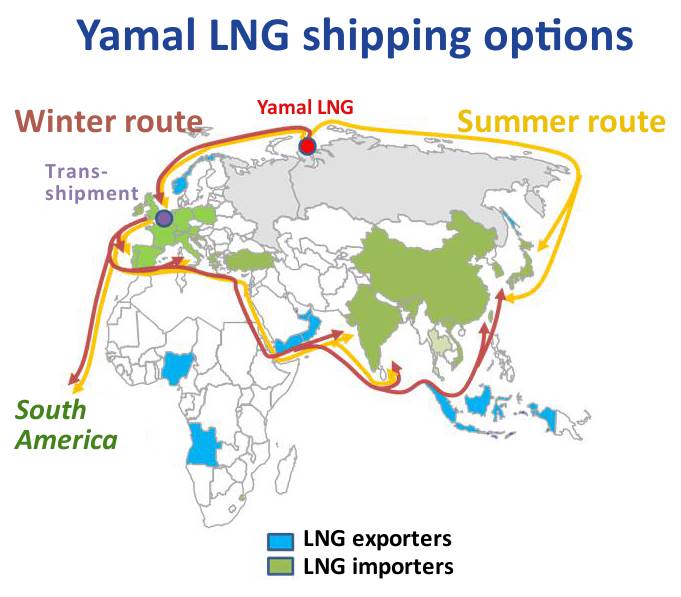
The Yamal LNG project represents the largest ongoing Arctic commercial investment and is a large reason why the Northern Sea Route saw record activity in transported cargo in 2016. It has also driven local infrastructure investments. The proposed 3.22 billion USD railway connecting Sabetta Port to the Eurasian railway network was recently awarded Russia’s infrastructure project of the year [Jiang et al.,2018].
Today, China is investing a lot of money in the development of Greenland. In 2017, Shanghai-based Shenghe Resources bought a 12.5% stake in Greenland Minerals and Energy A/S, becoming its largest shareholder and getting the right to increase its stake in the flagship project of the Greenland uranium mining company in Kwanefjeld to 60% [Jun&Zadek, 2019].
Another Arctic country, Iceland, enjoys special attention from China as well. Iceland’s central location in the northern hemisphere makes it an ideal northern entrance to Europe from East Asia, similar to the prosperity of the port of Piraeus in Greece, which is a few years should handle up to 6.2 million TEU per year, which will make it one of the five largest ports in Europe [Jiang et al.,2018]. Over time, Iceland may become the same transhipment hub in the Atlantic Arctic, expanding the infrastructure according to needs, as the international shipping network expands through Arctic routes.
China is also actively exploring the transhipment possibilities in the Arctic Ocean basin. Thus, the climatic motivating factor for China in the development of the Arctic using the Trans-Arctic Sea route (hereinafter TSR) is mentioned by many experts, linking it with economic benefits. The Northern Sea Route is a gold mine, with access to which China will be able to increase its exports not only to already established partner countries but also will have the opportunity to discover new trade chains.
Chinese maritime transport enterprises are constantly studying the economic potential of the Arctic waterways. The fleet of Chinese container ships (Yang Ming Marine Transport Corp) is being updated at an accelerated pace.
The Polar Silk Road Program consistently reveals its Arctic ambitions. Its’ concept appeared as the Northeast Passage became increasingly associated with Asia, especially China [Jiang et al.,2018]. Thus, the Belt and Road Initiative is China’s infrastructure development strategy, which focuses on development and investment in 152 countries and international organizations on several continents. The “belt” refers to overland routes for roads and railways, and the “road” refers to the maritime Silk Road of the XXI century [Smotrytska, 2021b].
Apart from “Arctic powers”, climate change also opens up additional prospects for the development of the NSR. Thus, if global warming is happening and will continue in the coming years, then the amount and thickness of ice cover in the seas of the Arctic Ocean should decrease. According to the forecasts of Norwegian scientists, by 2080 there may be no ice left in the Arctic seas at all [Schøyen&Bråthen, 2011].
Towards Conclusions
Thus, the cumulative loss of output in the global economy in 2020 – 2021 as a result of the crisis caused by the pandemic is implied in the amount of over 12 trillion USD. The IMF predicted a significant decline in GDP growth in 2020. Nevertheless, the global economy is projected to grow 6.0 per cent in 2021 and 4.9 per cent in 2022 [IMF, 2021].
The global decline in economic growth has also had a negative impact on the overall growth of cargo flows in the regions of the world. What will be the demand for energy sources and their demand for consumers around the world after the global coronavirus pandemic and the decline in economic activity? It will increase significantly [FreighTos, 2021]. Therefore, the modernization and development of the global transport infrastructure are currently on the agenda of major geopolitical players.
For now, it can be seen that there are two possibilities for developing transport systems and economies in accordance with green standards:
- Transcontinental railroad system (which requires a huge number of investments);
- Optimization of the cheapest mode of transportation (maritime warm waters transhipment lines).
Given that the COVID-19 pandemic represents a supply and demand shock in the railway industry – both aspects affecting international trade in goods and services, maritime transport takes precedence in rebalancing transhipment activities [FreighTos, 2021].
Thus, today, one of the main directions of cargo flows is the Southern Sea Route (warm waters transhipment line), along which cargos move from the European part of the continent to the Asian one, the length of which is over 20.000 kilometres. This route is quite challenging in terms of geographical features and the presence of certain bottlenecks on the cargo route (for example, the Suez Canal, which, for natural reasons, hinders the free passage of goods).
Moreover, maritime transport defied the COVID-19 disruption. In 2020, volumes fell less dramatically than expected and by the end of the year had rebounded, laying the foundations for a transformation in global supply chains and new maritime trade patterns [IntlReg,2021e].
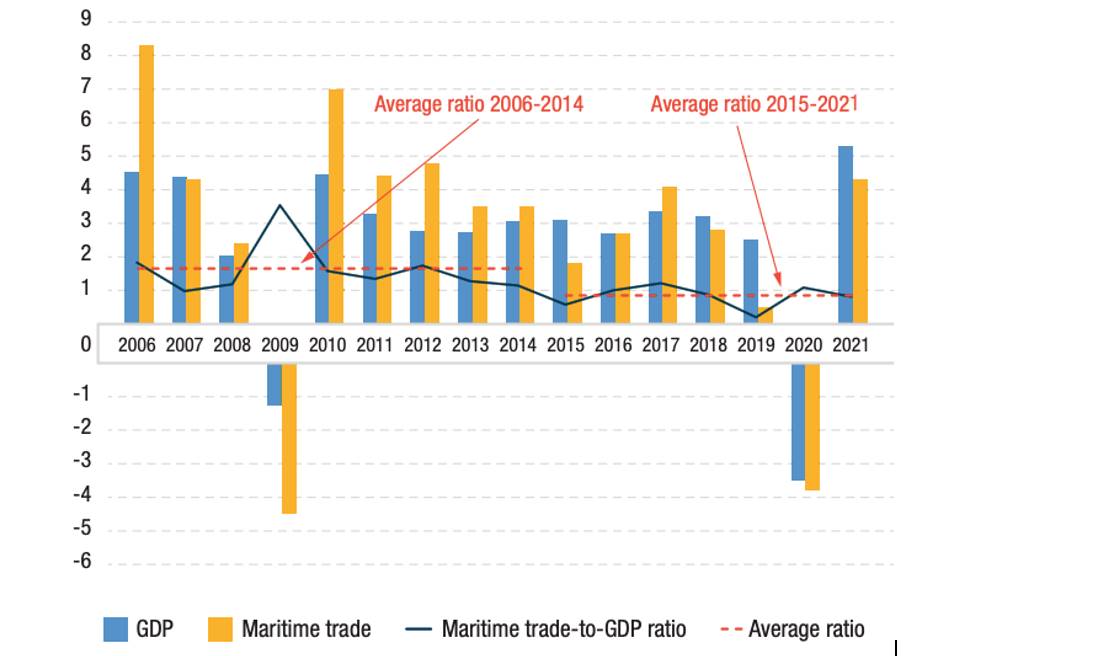
In 2021, in tandem with the recovery in merchandise trade and world output, maritime trade increased by 4.3% (See Figure 8) [Eurostat, 2021]. Thus, over the past two decades, compound annual growth in maritime trade has been 2.9%, but over the period 2022 – 2026, UNCTAD expects that rate to slow to 2.4% [UNCTAD, 2021].
Trade between countries in the context of a pandemic and after a pandemic can make a significant contribution to the recovery of the global economy. But thinking about the best ways to stabilize economic development and decarbonize transport links between the most productive G-7 countries (Atlantic states and other European countries) with other advanced OECD economies, all the existing risks (such as “convenience”, roads “safety” (piracy, oil spills), water congestion levels and maritime traffic) should be considered.
As it was mentioned above, warm waters transhipment lines (See Map 2) currently present certain dangers, being high congested and unsafe (both for trade security and environment), and hence rather vulnerable. Due to this fact, it is crucial to consider other alternatives of connecting the biggest countries-producers (Far East) and countries-consumers (West Europe).
The development of the cold waters (i.e., Arctic passage or blue line shipping line) route (See Map 1) may serve as an alternative which can be beneficially both in “convenience” and environmental issues because it is time-saving transportation of goods from the Far East to European countries, as well as the possibility of improving the energy problem in the world’s largest emitters, on the solution of which, in turn, depends on the regulation of the global environmental issue [Tonchev, 2017].
Comparing contrasts of Arctic and Antarctic transhipment roads, three possible passages may be considered (See Map 15). Nevertheless, though there is a high potential to slash international shipping distances by opening shorter routes in the north, the high risks on these alternative routes are keeping most traffic running over the classic transport routes like the Suez and Panama Canals.
Thus, the shortest sea trade route from the Atlantic Ocean to the Pacific lies through the Arctic waters. Due to global warming and melting of ice, the Northern Seas become quite accessible for optimizing navigation via several transhipment routes:
- Northern Sea Route (NSR) along the coast of Russia,
- North-West Passage (NWP) off the coast of Canada, as well as through
- a high–latitude near-polar route in the centre of the Arctic Ocean – Trans-Arctic Sea route (TSR),
- Arctic Sea Bridge (ASB) – between the ports of Murmansk (Russia) and Churchill (Canada).
The way from Canada to East Asia and the Atlantic Ocean through the Northwest Passage – North-West Passage (NWP) is 7.000 km shorter than the way through the Panama Canal. A shorter route means saving not only time but also money (lower fuel consumption, lower transit fees). Back in August 2008, the Danish cable ship “Peter Faber” easily overcame the way through the Northwest Passage from Taiwan to the destination located between Newfoundland and Greenland [Herrmann, 2019].
The multiplicity of shipping routes in the Arctic is located precisely along the coast of Eurasia with the shortest – the promising Trans-Arctic Sea route from the Atlantic Ocean to the Pacific Ocean through the centre of the Arctic Ocean.
At the same time, the Polar Silk Road of China, connecting Asia and Europe, helps to significantly modernize the infrastructure of the Northern Sea Route and implement investment projects of oil, gas, and mining complex of global importance. All this generates new challenges and opportunities for the development of the Arctic, due to geographical, economic, resource and geopolitical significance.
Among other things, the chosen direction of development of the Northern Sea Route is due to several factors at once. The Northern Sea Route is the most promising transport artery in the world in the next few decades since this route brings several significant benefits:
- significant fuel savings;
- reduction of transportation time;
- reduction of personnel labour costs and reduction of ship freight;
- no payment for the passage of the vessel, unlike the Suez Canal (at the moment);
- low route congestion and no queues;
- no pirates; alternative solutions to the problem of energy resources and stable supply [AB, n.d.].
For greater clarity, one can consider an example with fuel: for the transition from Europe to China along the NSR route, only about 35 days and 600 tons of fuel are needed, whereas using the route through the Suez Canal requires as much as 48 days and about 900 – 1.000 tons of fuel [Eurostat, 2021].
Along with the above advantages, the Northern Sea Route has a disadvantage – a long process of development and implementation of infrastructure that will allow year-round servicing of sea cargo vessels. The long and gradual reopening of ports will not allow the Northern Sea Route to compete with the traditional southern routes in the near decades [Furuichi & Otsuka, 2013].
While summing up the data on the logistics, it may be seen, that the Blue shipping line along with the Green one (See Map 1) will dramatically reduce the time between the most-producing countries of G-7 and advanced OECD markets.
But to reach a consensus in timing, price, and environmentally friendly standards the growing push to decarbonize economies, implementing green construction methods should be done. Unfortunately, this approach may take decades to be adopted, which our planet may not have. And understanding of this fact should underlie the development of all the countries of the Globe without exceptions.
Conflicts will of course arise between the green agenda and concerns about costs to consumers. These conflicts will be most apparent in countries where pressures from fast-rising populations and urbanization are the highest. The key question is whether governments prioritize short-term cost savings over longer-term benefits that come with sustainable development.
ACCESS (2015). Shipping in the Arctic: Links to air pollution and climate change. URL: hyperlink, (accessed 23/12/2021).
Akakura Y. (2020), Estimation of Economic Benefit of Major Chokepoint on Global Trade and Economy. Is the benefit of the Malacca Strait larger than that of the Suez/Panama Canal? IAME 2020 Conference, Paper ID 153.
Alarcón J. (2016), El canal de Kra, Blog de Geopolitica, URL: hyperlink, (accessed 21/12/2021).
Aljamra H. (2019), Bab-El-Mandeb, Gateway to the Red Sea: the World’s Most Dangerous Strait. Inside Arabia News, URL: hyperlink, (accessed 13/10/2020).
AP (2011), Turkey May Raise Fees for Bosporus Passage Use, The Hindu, 6, May.
Bajrektarevic A.(2010), Opening Up the Arctic Frontier. An Excerpt from Arctic and Antarctic: Two Poles. Addleton Academic Publishers, New York, URL: hyperlink, (accessed 23/12/2021).
Bajrektarevic A.(2013), No Asian Century, THC (ASEAN), Jakarta, RI
CEU (2009). Council Conclusions on EU position for the Copenhagen Climate Conference. Council of the European Union, URL: hyperlink, (accessed 13/10/2020).
CFC (2021), Shipping Routes from China, CFC News, URL: hyperlink, (accessed 23/12/2021).
Ducruet C. (2016), The polarization of global container flows by interoceanic canals: geographic coverage and network vulnerability, Maritime Policy & Management, 43(2), 242-260.
EC (2020), An EU-wide assessment of National Energy and Climate Plans. Driving forward the green transition and promoting economic recovery through integrated energy and climate planning, European Commission Briefs, URL: hyperlink, (accessed 13/10/2020).EEA (2015). EEA greenhouse gas data viewer. EEA Europe, URL: hyperlink, (accessed 13/10/2020).
Einemo U. (2015). Conflicting messages on shipping ahead of Paris climate talks. Bunkerworld News. URL: hyperlink, (accessed 13/10/2020).
Elsevier (2019), Modal shift, emission reductions and behavioural change: Transport policies and innovations to tackle climate change. URL: hyperlink, (accessed 23/12/2021).
EPC (2015). Regulation (EU) 2015/ 757 on the monitoring, reporting and verification of carbon dioxide emissions from maritime transport, European Parliament and Council (29/04/2015). URL: hyperlink, (accessed 13/10/2020).
Ergocun G. (2020), Over 41,000 vessels pass through Bosphorus in 2019. URL: hyperlink, (accessed 13/10/2020).
Essallany M., Bari A.A. and Kotb M. (2019), Spectral fatigue analyses comparison study: Suez Canal vs. Cape of Good Hope Arab Academy for Science, Technologies and Maritime Transport (AASTMT), Journal of Marine Engineering & Technology, 19, (4), 107-110.
Eurostat (2021), Maritime transport of goods – quarterly data, Eurostat Statistics Explained, URL: hyperlink, (accessed 23/12/2021).
FAO (2014). Agriculture, Forestry and Other Land Use Emissions by Sources and Removals by Sinks. FAO Report, URL: hyperlink, (accessed 13/10/2020).
FreighTos (2021), Shipping & Freight Cost Increases, Freight Capacity, and Shipping Container Shortage [2021 & 2022], Freightos Briefs, URL: hyperlink, (accessed 23/12/2021).
FN (2019), The Bab el-Mandeb Strait is a strategic route for oil and natural gas shipments, Freight News, URL: hyperlink, (accessed 21/12/2021).
Furuichi M. and Otsuka N. (2013), Cost Analysis of the Northern Sea Route (NSR) and the Conventional Route Shipping, Proceedings of the IAME2013 conference, Paper ID 10.
Gao T. and Lu J. (2019), The impacts of the strait and canal blockages on the transportation costs of the Chinese fleet in the shipping network, Maritime Policy & Management, 46(6), 669-686.
Gençsü, I. and Hino, M. (2015). Raising ambition to reduce international aviation and maritime emissions. New Climate Economy. The report, URL: hyperlink, (accessed 13/10/2020).
GovC (n.d.), The White Book on Arctic Policy. URL: hyperlink, (accessed 13/10/2020) (In China.).
Herrmann T. (2019), Shipping Through the Northwest Passage: A Policy Brief, The Henry M. Jackson School of International Studies, University of Washington.
Huaxia (2018), “Finnish-Norwegian blueprint of Arctic corridor unveiled”, The Xinhua news agency, URL: hyperlink, (accessed: 9 September 2021).
ICIS (2017), China Sets 15% non-fossil Energy Consumption Target by 2020. ICIS Report, URL: hyperlink, (accessed 13/10/2020).
ICS (2015). Delivering CO2 Emission Reductions. ICS Shipping Briefs, URL: hyperlink, (accessed 13/10/2020).
IEA (2014), CO2 emissions from fuel combustion 2014. Paris. URL: hyperlink, (accessed 13/10/2020).
IMF (2021), World Economic Outlook Update, July 2021: Fault Lines Widen in the Global Recovery, IMF World Economic Outlook, URL: hyperlink, (accessed 23/12/2021).
IMO (2014). Reduction of GHG emissions from ships, Third IMO GHG Study 2014. Final report. London.
IntlReg (2019), IMO Navigation Rules at Straits of Malacca and Singapore, Shipping News, URL: hyperlink, (accessed 23/12/2021).
IntlReg (2021a), Panama Advances With A Firm Step In The Global Maritime Sector, Shipping News, URL: hyperlink, (accessed 23/12/2021).
IntlReg (2021b), Panama renews maritime transport agreement with China, Shipping News, URL: hyperlink, (accessed 23/12/2021).
IntlReg (2021c), New programme for West Africa maritime security, Shipping News, URL: hyperlink, (accessed 23/12/2021).
IntlReg (2021d), Global maritime industry towards a decarbonized future, Shipping News, URL: hyperlink, (accessed 23/12/2021).
IntlReg (2021e), Sustainable maritime transport critical to global recovery, Shipping News, URL: hyperlink, (accessed 23/12/2021).
IRENA (2015). Renewable energy options for shipping: Technology brief. AIRENA Briefs, URL: hyperlink, (accessed 13/10/2020).
Jiang B., Li J., Gong Ch. (2018), Maritime Shipping and Export Trade on “Maritime Silk Road”, The Asian Journal of Shipping and Logistics, 34, (2), 83-90.
Jun M. and Zadek S. (2019), BRI investments need to be climate-friendly. The Irish Examiner, URL: hyperlink, (accessed 13/10/2020).
Kiiski, T. (2017) “Commercial cargo shipping along the Northern Sea Route: Destination-oriented and globally marginal”, Baltic Transport Journal (1/2017), pp. 34-36.
Liua, M. and Kronbakb J. (2010), The potential economic viability of using the Northern Sea Route (NSR) as an alternative route between Asia and Europe. URL: hyperlink, (accessed 13/10/2020).
LL (2021), 10 predictions for 2022, The Lloyd’s List Podcast, URL: hyperlink, (accessed 23/12/2021).
Lu, D., Park, G. K., Choi, K., & Oh, S. (2014). An Economic Analysis of Container Shipping through Canadian Northwest Passage. International Journal of e-Navigation and Maritime Economy, 1, 60-72.
MAERSK (n.d.), Shipping from the Asia Pacific to Europe, MAERSK Statistics.
Mogh-Rusli M. H. (2012), Maritime Highways of Southeast Asia: Alternative Straits?, RSIS Commentary, Nanyang Technological University, 12024.
MoW (2017), Why was the building of the Panama Canal important to the United States? URL: hyperlink, (accessed 21/12/2021).
MTRF (2019), The General Scheme for Deployment of the Transport Logistics Centers Network (within the transportation part of the Federal Project ‘Comprehensive Plan for the Modernization and Expansion of the Core Infrastructure up to 2024’), Ministry of Transport of the Russian Federation, URL: hyperlink, (accessed 23/12/2021).
MW (2020), Cleaves Panama canal just made VLGC transit harder. Maritime watch, URL: hyperlink, (accessed 13/10/2020).
Notteboom Th., Pallis A. and Rodrigue J.-P. (n.d) Port Economics, Management and Policy, New York: Routledge, 624 pages / 218 illustrations. ISBN 9780367331559
OIES (2019), LNG Supply Chains and the Development of LNG as a Shipping Fuel in Northern E
Napomena o autorskim pravima: Dozvoljeno preuzimanje sadržaja isključivo uz navođenje linka prema stranici našeg portala sa koje je sadržaj preuzet. Stavovi izraženi u ovom tekstu autorovi su i ne odražavaju nužno uredničku politiku The Balkantimes Press.
Copyright Notice: It is allowed to download the content only by providing a link to the page of our portal from which the content was downloaded. The views expressed in this text are those of the authors and do not necessarily reflect the editorial policies of The Balkantimes Press.