
Top Insights
- Most startups (~74%) fail due to growth-related issues, NOT product
- Growth cycle: product road mapping > acquisition > activation > retention
- Retention is the most important metric to startup success
- Strategic friction during onboarding can lead to stronger retention
- Core retention metrics are lagging indicators (by 3-12 months), but you can create proxy metrics that are leading indicators
Check out the Scaling Your Startup playlist
Check out the full Growth deck
Watch the full episode
Intro
Guests:
Craig Zingerline | @craigzingerline
- Founder & CEO, Growth University (2020-Present)
- growthuniversity.io
Allen Chen | @allenchen1217
- Co-Founder & CEO, Fitbod (2015-Present)
- fitbod.me
Why startups fail (slide 3)
- 74% of startup failures are growth-related
- Startups that “make it” have the following characteristics (source)
- Grow team slowly
- Spend less on paid marketing early on
- Launch products faster, even if imperfect
- Why startups fail via CB Insights Study: No market need (42%), Ran out of cash (29%), Not the right team (23%), Get outcompeted (19%), Pricing/cost issues (18%), User unfriendly product (17%), No business model (17%), Poor marketing (14%), Ignoring customers (14%), Product mistimed (13%)
Fitbod’s take on why startups fail (slide 4)
- Lack of focus on the customer
- Fitbod started with a single-user persona
- Allen and his co-founder were the first users, so they understood their customer inherently
- Only scaled the team as the product scaled
- Found a tight customer feedback loop by talking directly with engaged customers
- Found their market white-space: there was no great product for the self-motivated resistance and strength trainers
- Perfectionism where it matters
- Fitbod iterated and perfected the product before focusing on scaling any other aspects of the business
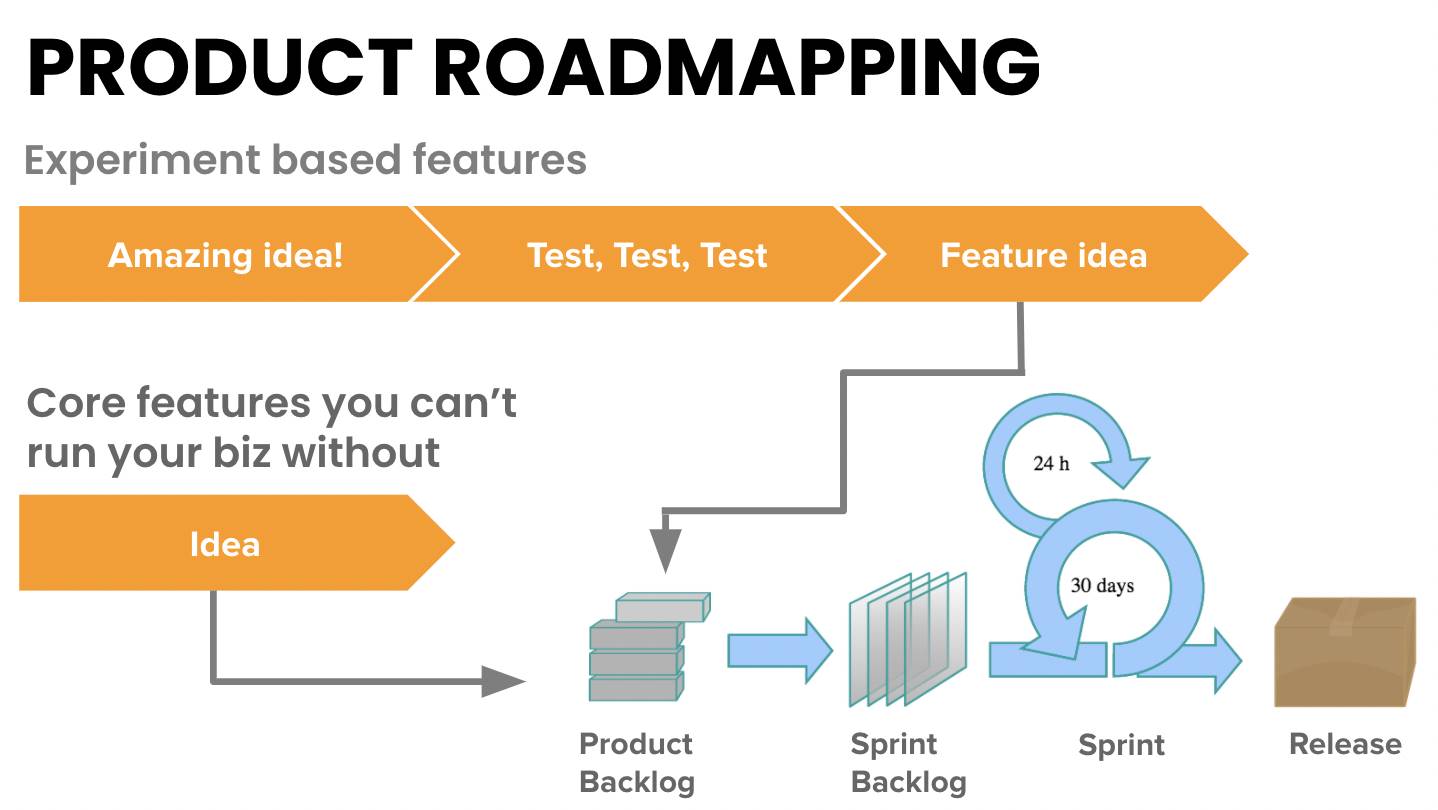
Product road mapping (slide 6)
- Two streams of development while building a high-growth startup:
1) core feature development
- features that your product cannot exist without
- ie: payments processing for a travel booking website
- be careful: this is where startups can “overbuild”
2) experiment-based feature development
- you can leverage experiments and customer feedback to define your roadmap outside of core features
- The fastest-growing startups find ways to blend these together
Fitbod’s product road mapping focus (slide 7)
Fitbod’s product roadmap principles:
Craftsmanship
- build something that you’re proud to share with your friends and family
- build something that you can happily use
Minimum Winnable Product
- not Minimum Viable Product
Always make progress
- each iteration of the product is an improvement
Leverage their core differentiator
- they prioritized features that leveraged and highlighted their core differentiator: a workout recommendation engine
Delight early adopters
- constant improvements and iterations build trust with early users
Building a growth model (slide 9)
“Put together a model that gives you a sense of ownership arounds goals and metrics for your business.” – Craig Zingerline
- Example:
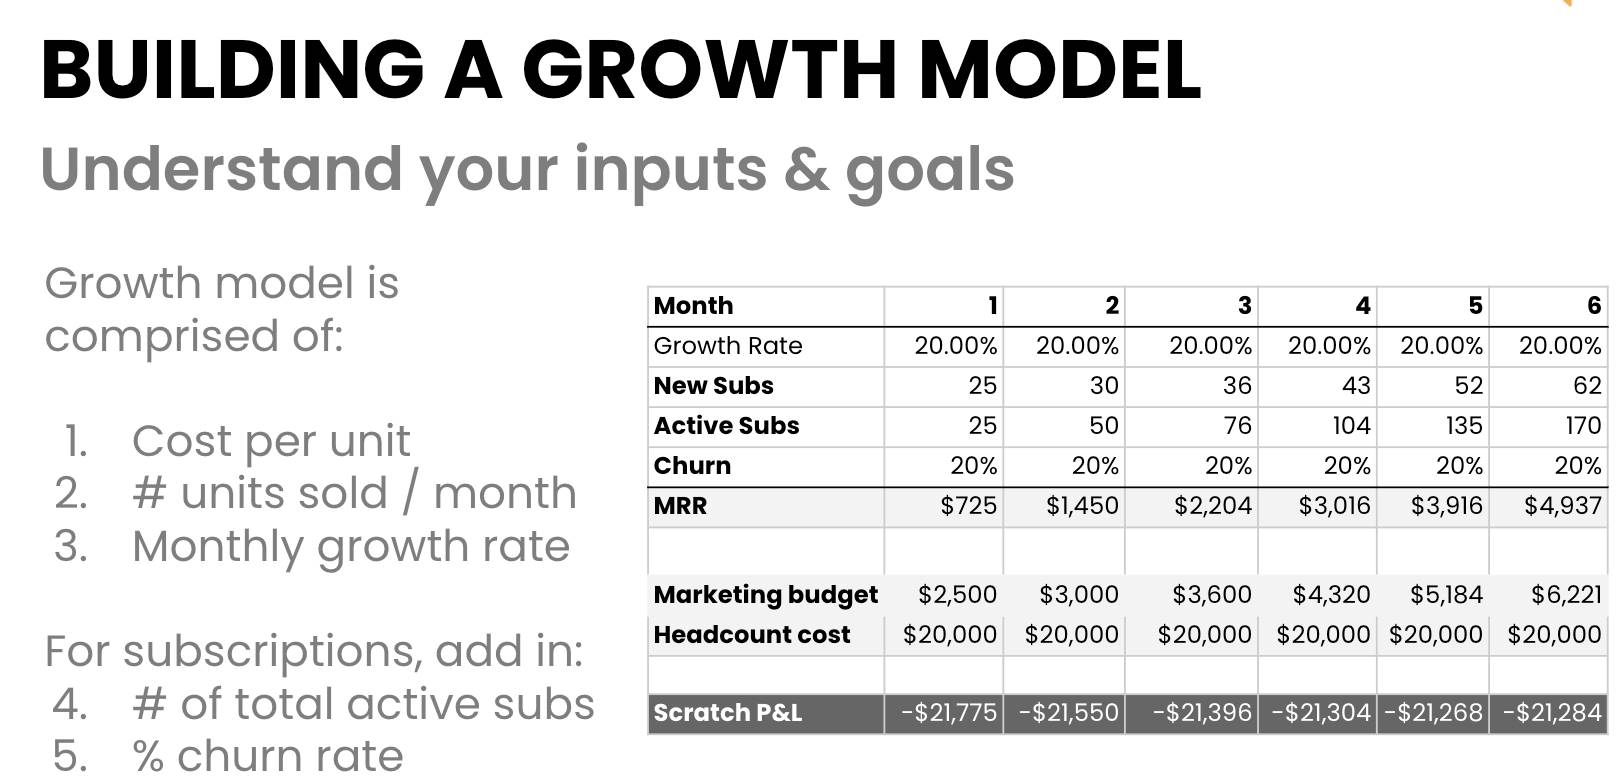
Tips:
- At the end of each month, plug in your numbers and update your forward-looking model so you can better understand where to deploy capital
- Understand if you spend (X) on organic growth what did it yield (Y) in a given timeframe?
- If you want to raise money from venture capitalists, you’re going to need to execute on a growth model that’s projecting 20% MoM growth.
Fitbod’s growth model focus (slide 10)
- Understand key growth levers (for Fitbod these were organic & word-of-mouth referrals)
- Define marketing and payroll budgets
- Understand burn and how to reach profitability
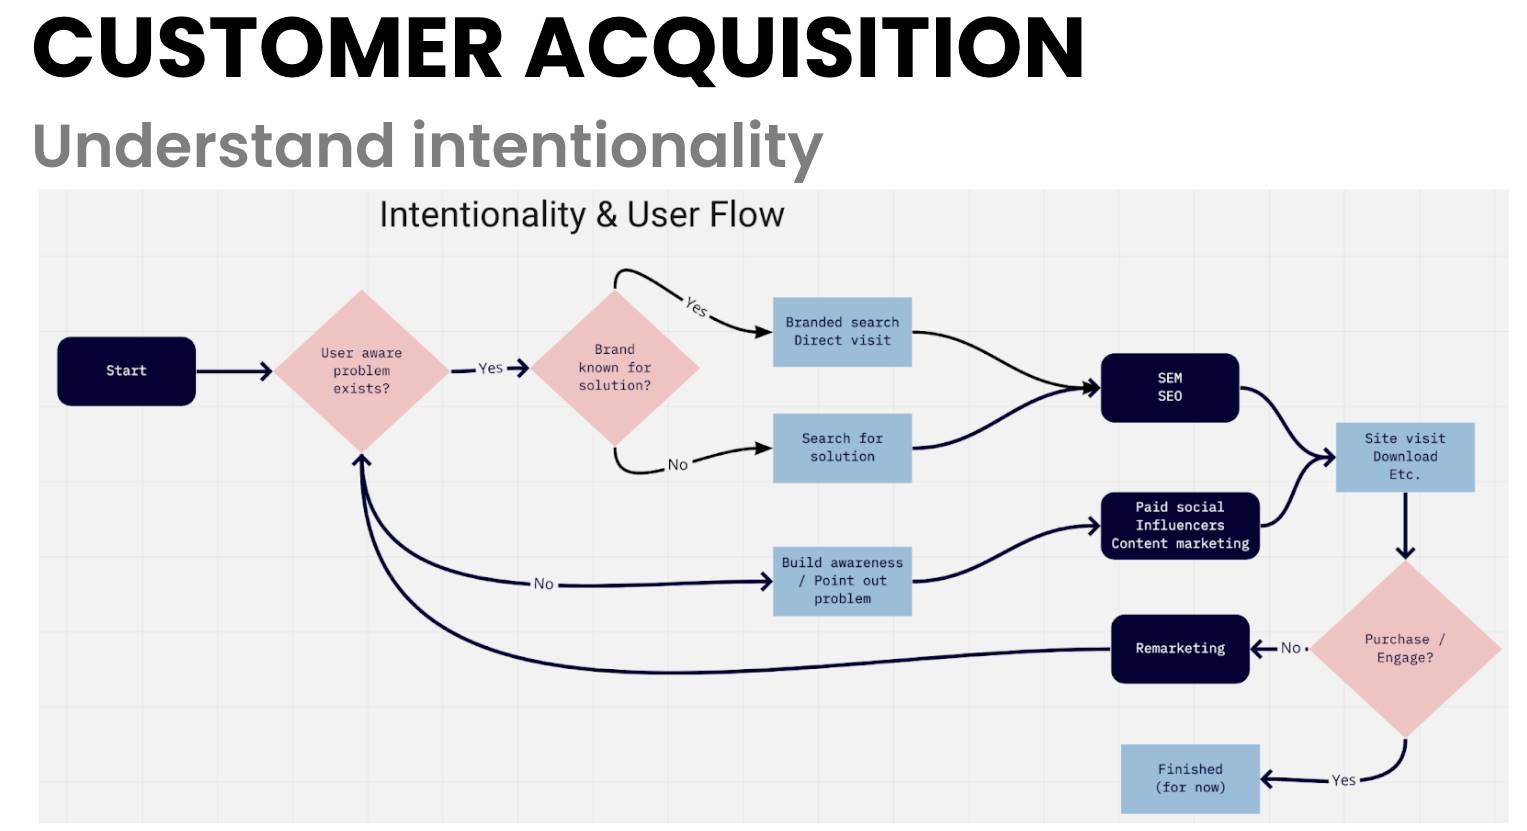
Customer acquisition (slide 12)
- Founders get tripped up when they don’t understand the intentionality of their audience
- For example, if a user knows they have a problem and they’re actively searching for a solution, paid and organic search are the best channels
- However, typically consumers don’t know what the problem that they need solving is (especially in consumer)
- In that case, it’s your job to inject your brand in front of people where they hangout
- That’s where paid social, influencer, and content marketing come into play
- Example:
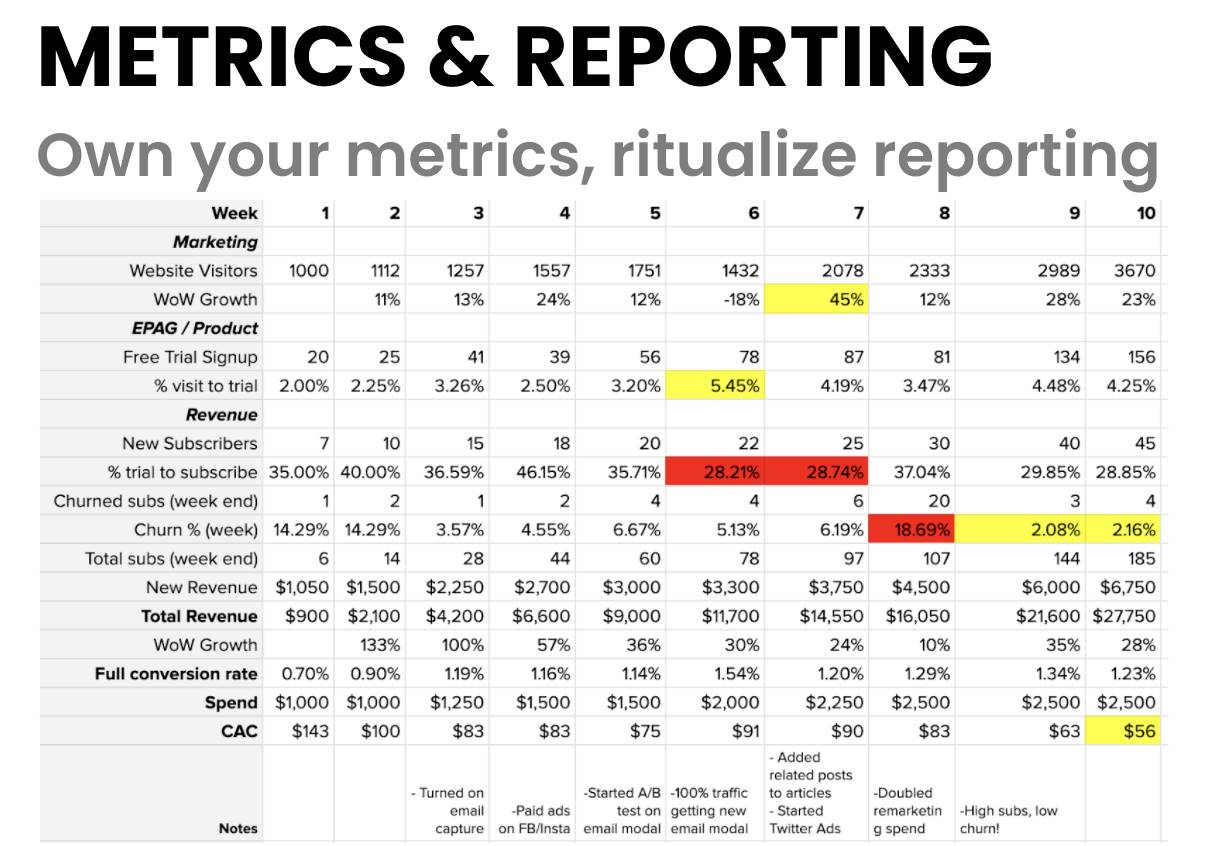
Metrics & reporting (slide 13)
- It’s really hard to grow your business strategy if you don’t know what you’re going after
- Get into a cadence (Craig does it weekly) of analyzing and owning reported metrics
- Include a top of funnel metric (marketing), a middle of funnel metric (product), and bottom of funnel metric (revenue)
- Goal: Be able to eventually start to spot trends in your metrics
Example:
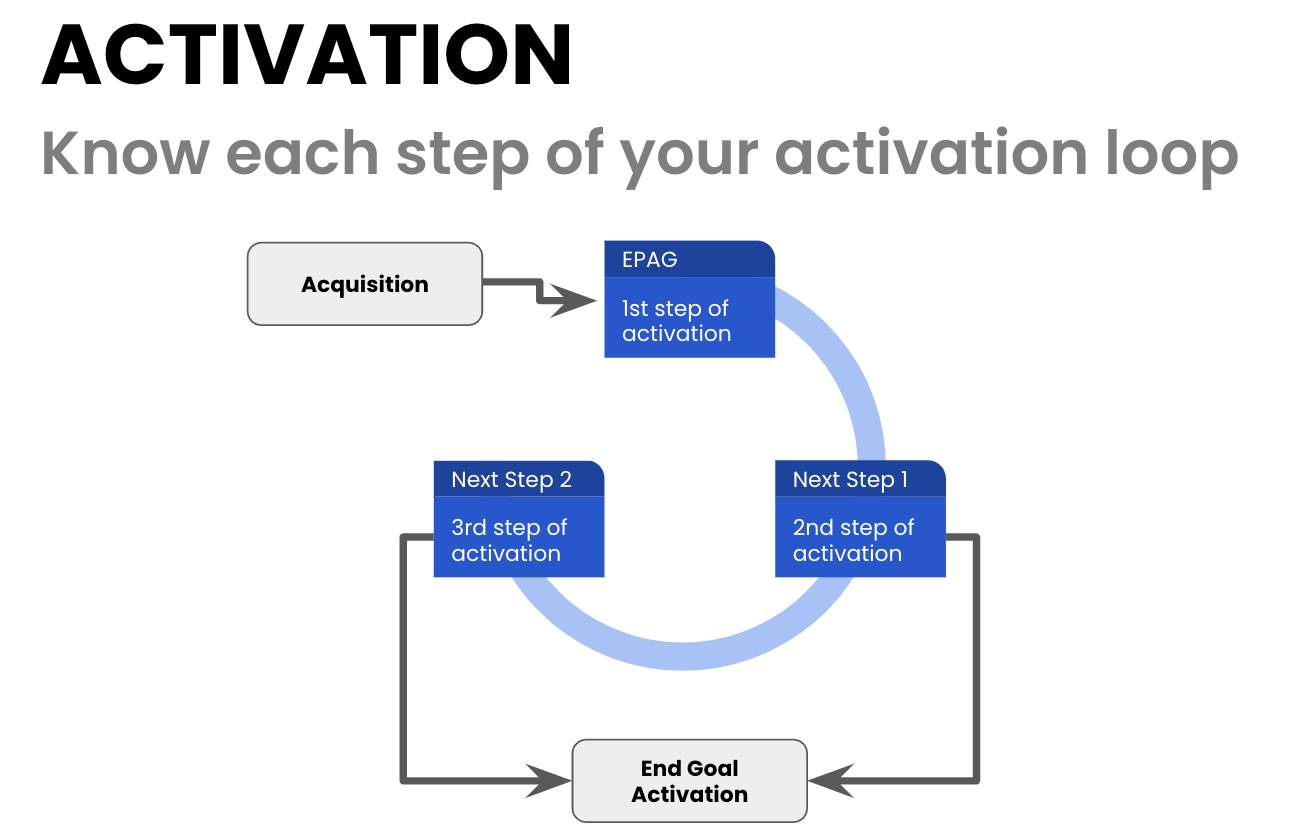
Activation (slide 14)
- Customer activation comes after customer acquisition
- When you hand off from acquisition to activation, there is an end-point acquisition goal (EPAG) at the product-level
- An EPAG is your main goal for the customer (IE get their email address, book a demo, invite other team members to a trial, etc.)
- Your EPAG should begin a cycle of further customer goals (see below) that eventually end up at a revenue-based goal
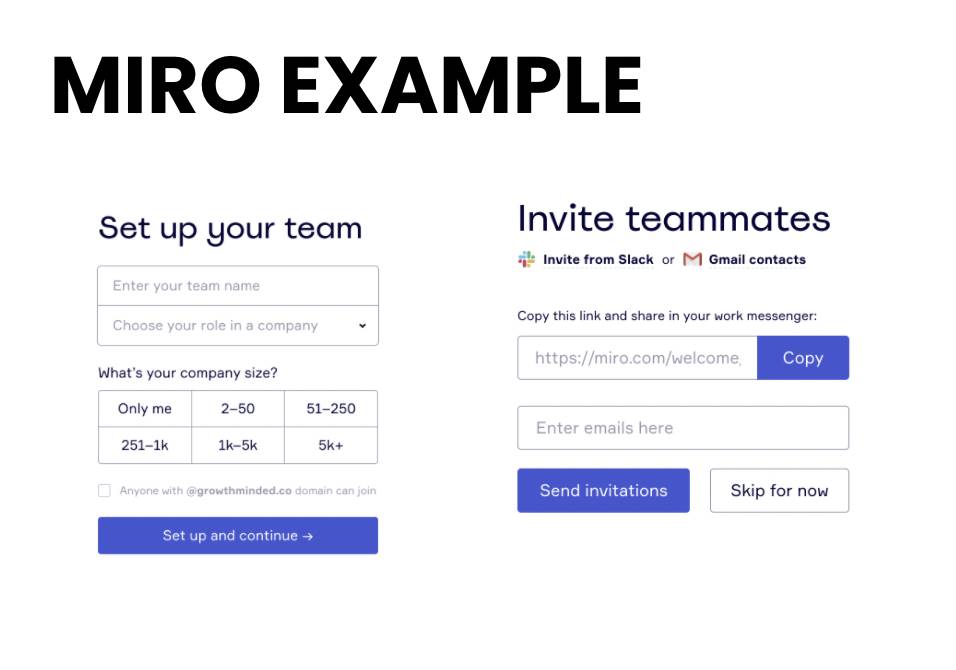
Miro activation example (slide 15)
- Miro is a fast-growing startup that sells access to a collaborative digital whiteboard
- Their activation process relentlessly focuses on getting the user into a “sign up for a free trial” flow
- Right after asking for your name and email, they immediately start asking to set up your team and add team members
- Their goal is to make it inherent for you to want to sign up team members
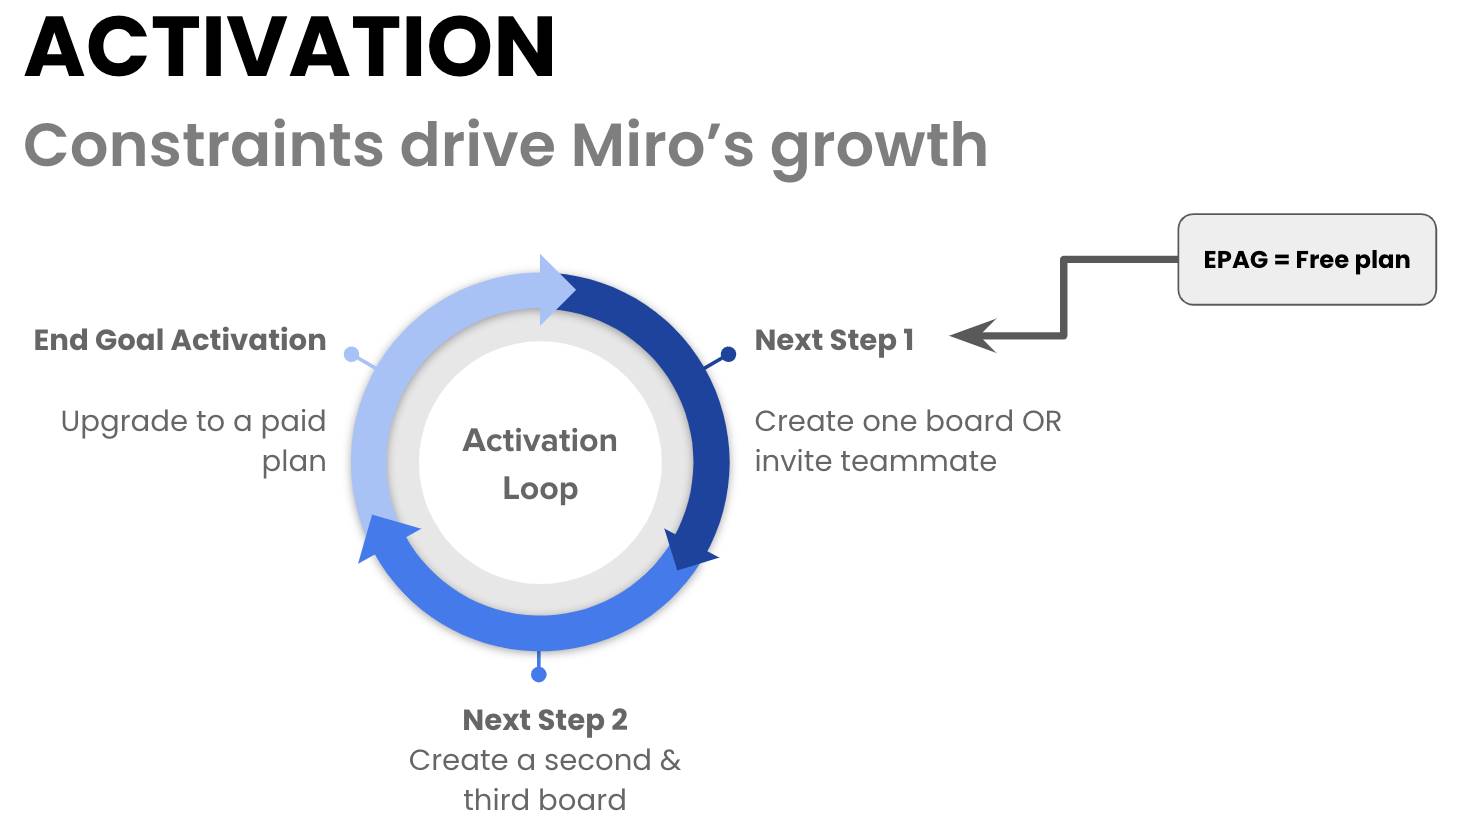
Miro activation cont. (slide 16)
- Miro leverages constraints to bump new users up against their free-tier limits
- On Miro’s free tier, you’re only allowed 2-3 free whiteboards
- So, if you invite two or three team members, and they both create boards of their own, you’ve already exceeded their free offering!
Optimizing activation (slide 17)
- Activation is a broad topic that encapsulates on-boarding, customer acquisition, product lifecycle & more
- To optimize activation, you can either:
- pick a single area of focus that might be underperforming in your metrics
- for example, maybe you’re doing a good job getting customers to sign up, but a bad job converting them from free to paid
- or if you’ve already done that, you can focus on the entire process and pick off the lowest effort, highest returning set of items to work on which then become added to your product roadmap
- Helpful resource: Intercom’s RICE method for framework
Fitbod’s acquisition focus (slide 18)
- Fitbod focuses on new user experience (they call it NUX internally)
- Why? Because most users will experience your on-boarding flow directly after downloading
- So, Fitbod iterated their on-boarding process multiple times to make sure users could see value within the first few minutes of signing up
- Case study: When Fitbod started (around 2015-2016), the prevailing theory was that top tier on-boarding involved signing up the user in the least amount of clicks possible
- However, Allen and the team realized that for their users to have the best experience, they actually needed to do the opposite and create an engaging onboarding experience that ended with their algorithm constructing the user’s first workout
- Fitbod offers a three workout free trial for new users with no purchase required, in order for users to experience their core value propositions
- This process is optimized to attract the highest quality users possible
- Their final step in conversion was closing the loop with referrals, or enticing users to invite their friends and colleagues to the platform
- Takeaway: Strategic friction during onboarding can lead to stronger retention
Retention (slide 20)
“… I would say, probably, retention is the most important, most critical part of running a business.” – Craig Zingerline
- Core retention metrics: churn, net revenue retention, gross revenue retention, subscriber growth rate
- Core metrics are invaluable, but the problem with them is that they can take 3-12 months to properly track and use to figure out a retention model
- Core metrics are lagging indicators
- However, you can use Proxy metrics to gain insight into retention quickly
- Proxy retention metrics: action-based (ex: hours of content consumed/month for Netflix)
- Core metrics are lagging, proxy metrics are leading
Fitbod’s retention focus (slide 21)
“With retention, we don’t want to go through all of the hard work to acquire users and convert them into paying subscribers just to see them churn early in their membership.” – Allen Chen
- Fitbod looks for potential long-term users because those users eventually become champions of the app and tell all of their friends about it
- Fitbod’s proxy measures: engagement, workouts/month, predictive churn model that measures customer health
- They built a predictive churn model via inputs from their customer success and data science teams
- Retention is the laggiest and most important metric for startup success
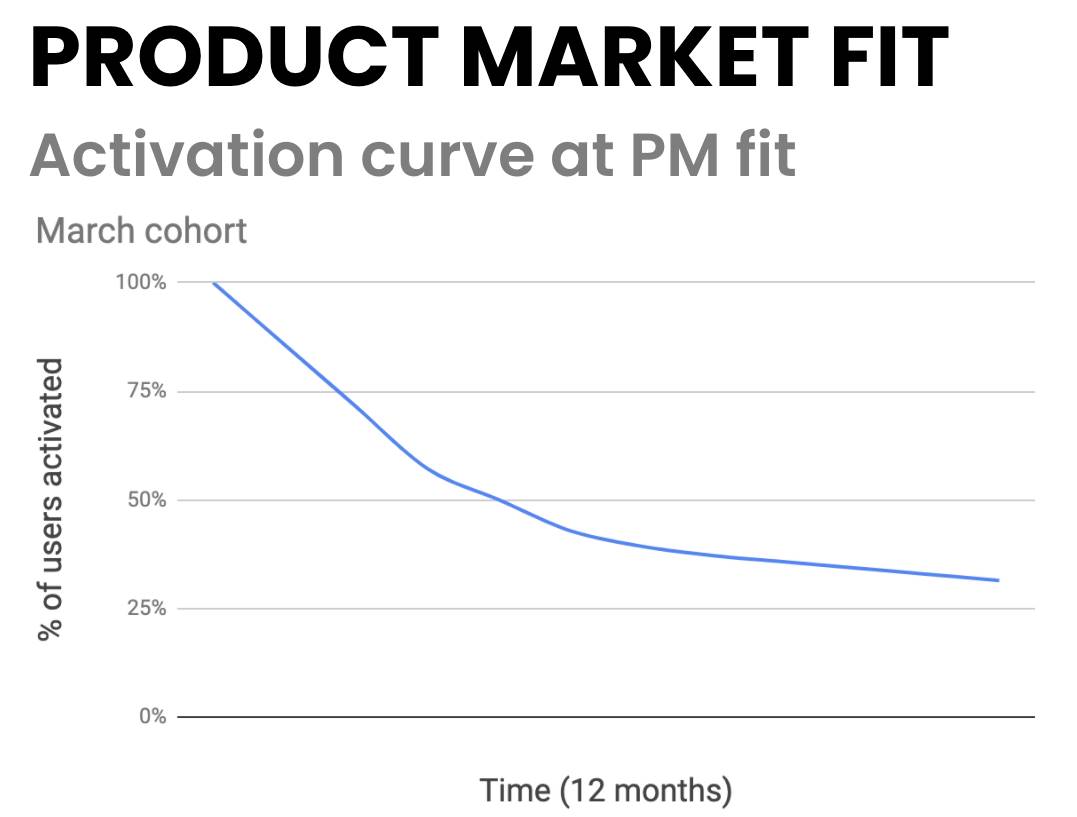
Product-market fit (slide 22)
One way to know you have some level of product-market fit:
- You start charting user activation for a cohort (IE users that signed up over the month of March)
- What happens to those users over time? Are they still taking the core actions necessary to be an engaged subscriber?
- If users continue falling off over time and eventually the line goes to zero, you do not have product-market fit
- However, if the line starts to flatten (see below), and a certain percentage of users are retained over a long period of time, that’s a great indicator that you’ve achieved some level of product-market fit
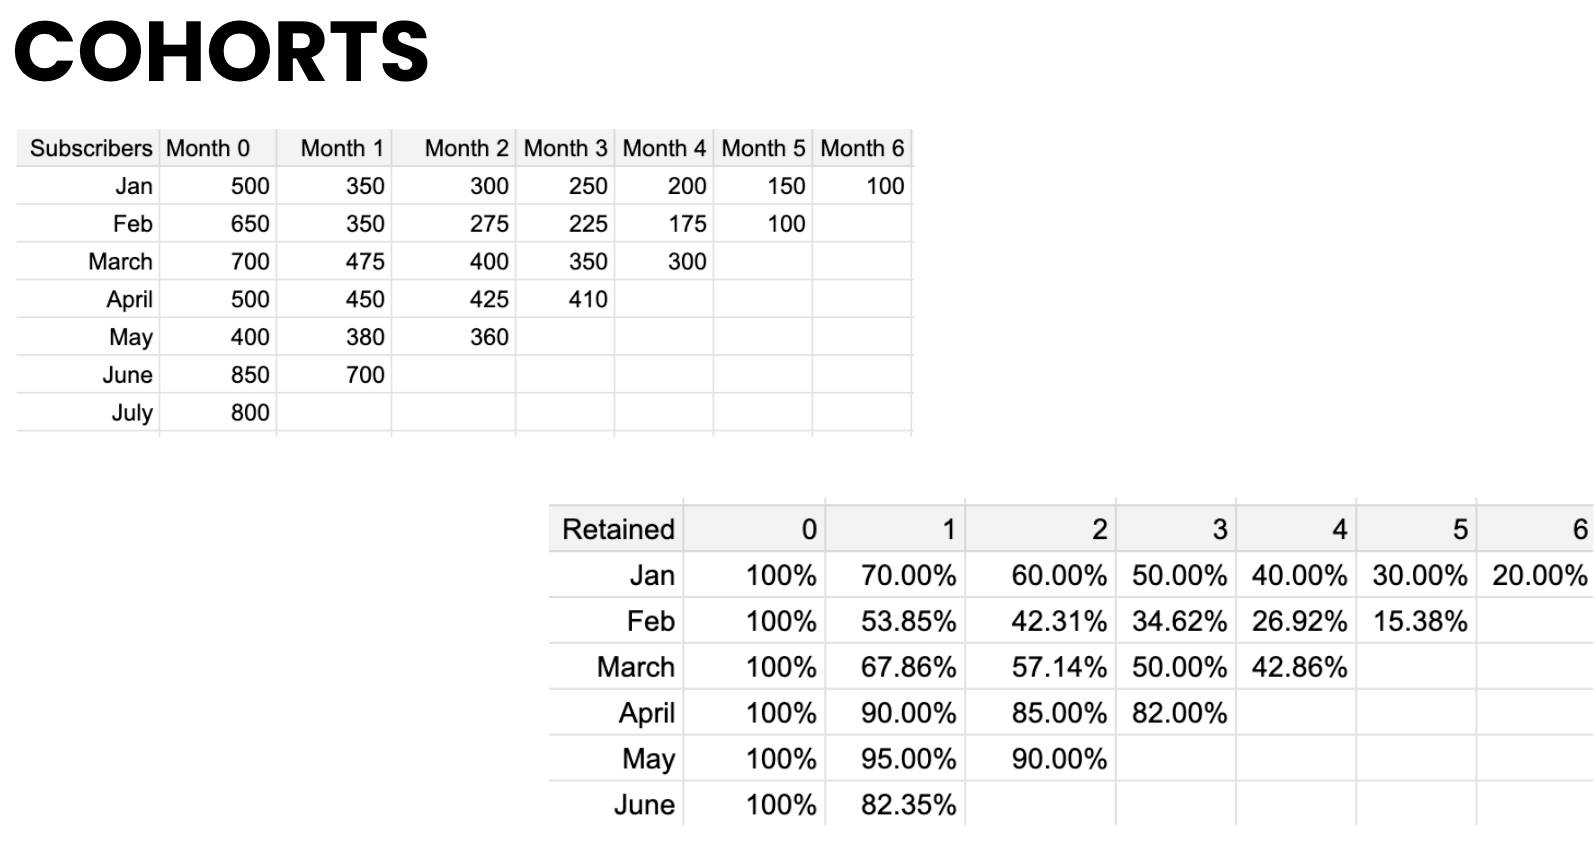
Cohort analysis (slide 23)
- If you don’t have a data scientist or anyone in charge of metrics, pulling cohort data could be difficult and time-consuming
With cohort data, you want to:
- plot your core action (signups, usage, etc.) on a monthly basis
- look at what is happening month to month
- ideally, your month 0 and month 1 metrics get better over time, signaling users are getting more engaged faster
- you also want to see that your retention metrics are also improving towards the tail end of the chart, which signals strong long-term value for users
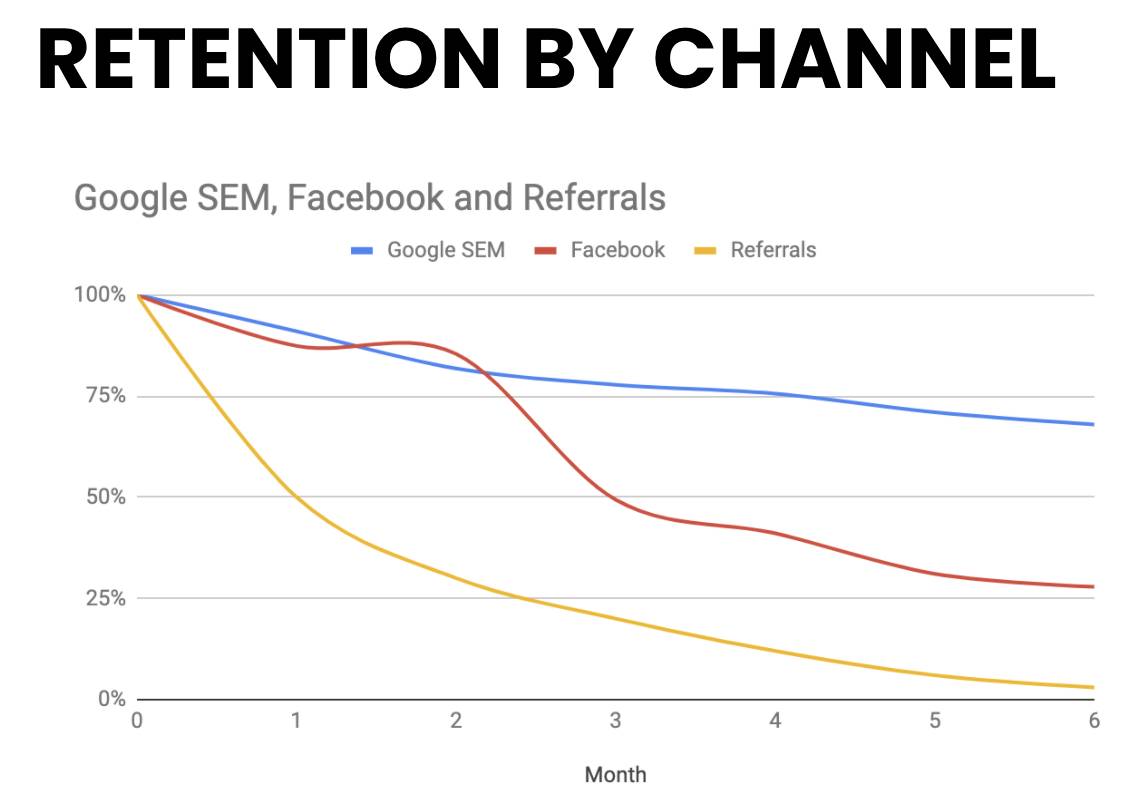
Retention by channel (slide 24)
- Running a broad report on retention includes the risk of missing false positives and false negatives
When you break it down by channel, you can start to figure out things like this example:
- Leads from Google are much stickier and have a higher LTV than leads from Facebook
- BUT leads from Google also cost 20x more to acquire
- Understanding the LTV/CAC ratio per channel is crucial for success because you can allocate more capital to channels with higher efficiency
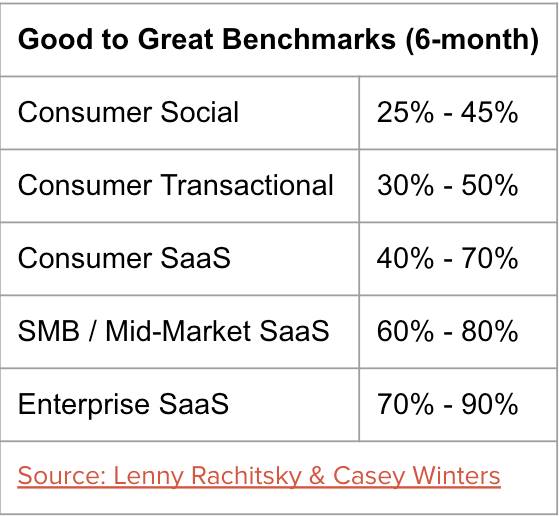
Summary
- Retention varies wildly by industry, stage, and channels
- Consumer social scales faster is harder to monetize and has lower retention
- Enterprise SaaS scales slower has a longer sales cycle, but retention is higher
- Here are good (left %) and great (right %) retention benchmarks for various industries:
Napomena o autorskim pravima: Dozvoljeno preuzimanje sadržaja isključivo uz navođenje linka prema stranici našeg portala sa koje je sadržaj preuzet. Stavovi izraženi u ovom tekstu autorovi su i ne odražavaju nužno uredničku politiku The Balkantimes Press.
Copyright Notice: It is allowed to download the content only by providing a link to the page of our portal from which the content was downloaded. The views expressed in this text are those of the authors and do not necessarily reflect the editorial policies of The Balkantimes Press.